Not entirely certain about what defines a competent copywriter? You’re not alone, given that the concept of copywriting frequently causes confusion.
Often juxtaposed with content writing, many people mistakenly use these terms synonymously. However, they’re not precisely the same. So, what exactly does copywriting entail, and how does it diverge from other types of content generation?
Let’s clarify this quickly.
Copywriting is inherently objective-oriented. The creator of the advertisement or other marketing materials aspires to stimulate the reader to take a specific action. Copywriting can encompass call-to-actions (CTAs), email content, social media ads, and all other forms that incite users to buy or convert.
It’s indisputable. The choice of words in your sales copy can have a massive impact. Consider this case study from the web design and SEO agency WiseU (they made the case study on how impactful can be different CTAs). They experimented with four different CTAs:
- Free estimate
- Free quote
- Get a quote
- Get a price
As might be expected, the ‘Free Quote’ CTA emerged victorious. The allure of ‘free’ is hard for most of us to resist, and ‘quote’ conveys the promise of something tangible, as opposed to a mere estimate.
It was a subtle deviation from the initial CTA, ‘Get a Quote,’ but it nonetheless resulted in a small, quantifiable uptick in click-throughs.
While nobody can’t promise you similar outcomes, this guide will demonstrate how to craft copy that not only drives sales but also delights your customers. More often than not, positive results will follow.
What exactly is copywriting?
As previously described, the purpose of copywriting is to persuade the audience to perform a specific task. This could involve encouraging the reader to subscribe to a newsletter, click for more product information, or advance them through a sales journey. The perfect blend of copywriting not only boosts sales and conversions but also fosters valuable experiences for the brand’s target demographic.
Copywriting demands accuracy, efficiency, and a considerable degree of innovative problem-solving. The amalgamation of elements like features, advantages, and cost works collectively to influence a customer’s decision to make a purchase. The manner in which you articulate these facets and your worth is embodied in your copy, serving as your communication bridge to prospective clients.
Often, when we think of copywriting, our minds immediately go to sales. We think of catchy slogans, persuasive product descriptions, and compelling calls to action. However, it’s time to expand our understanding of copywriting and recognize its potential in a broader context. Not only can it drive direct sales, but it can also shape an organization’s image, attract new audiences, and even generate ad revenue. One of the most overlooked areas where copywriting shines is within the media industry, where copywriters can assume the role of content creators or editors, curating engaging content that attracts traffic to web pages. Copywriting in the context of media is about creating and editing articles that can pique interest, stimulate conversation, and foster engagement. The goal is to create a steady stream of readership that keeps returning to the platform for more. A well-crafted article can boost traffic, increase time spent on the page, and enhance the platform’s overall visibility. This increased visibility and engagement make the platform more attractive to advertisers, thereby creating an additional revenue stream through the sale of ad spaces. The key to successful copywriting in the media industry is to prioritize the reader’s experience. This means producing high-quality articles that are informative, entertaining, and relevant to the reader’s interests. The better the content, the higher the chances of attracting and retaining readers. Copywriters, in this sense, must be able to wear many hats. They have to understand the audience’s interests, stay updated with current trends, and create content that resonates with the readers. They have to be journalists, researchers, and storytellers, all rolled into one. Not only does well-crafted content attract readers, but it can also significantly boost traffic. A well-researched, well-written, and compelling article can generate shares on social media, attract backlinks, and improve search engine rankings. This increased visibility leads to more visitors, further reinforcing the platform’s attractiveness to advertisers. With a steady stream of traffic and a dedicated reader base, media platforms become prime real estate for advertisers. A high-traffic website is more likely to attract businesses looking to advertise their products or services. Through effective copywriting, a media platform can create a win-win situation: readers get high-quality content, and advertisers get access to an engaged and targeted audience.
What is the difference between copywriting and content marketing?
Understanding the distinction between copywriting and content marketing is a common query that often arises.
Much like copywriters, the goal of content marketers is to secure the attention of users within a limited timeframe.
As per a certain study, users typically spend merely two minutes on a blog post before navigating away. Similarly, copywriters have only a fleeting moment to seize a user’s interest.
Nonetheless, the objectives of copywriting and content marketing diverge.
Content marketing primarily aims at indirect sales objectives such as educating, entertaining, or fostering brand recognition. This can be seen in forms like blog articles, white papers, e-books, and webinars.
On the other hand, the primary purpose of copywriting is to prompt readers to undertake a specific action, commonly seen in advertising, CTAs, and product narratives.
Consider my blog for instance.
The overarching theme of the blog is to enlighten you about copywriting, but nestled within it are individual pieces of copy, each with a unique objective.
Take, for instance, specific elements like the headline, call-to-action prompts – each of these has a more refined purpose. I’ve meticulously tailored every section to inspire you to undertake a specific action.
Let’s delve deeper into this.
The headline has been crafted to entice you to click the link from your search results and commence reading. Subsequently, the call-to-action (CTA) situated here will bring you to the contact form.
These instances represent copywriting nestled within a broader framework of content writing.
Why does copywriting matter?
Quality copy is the linchpin for driving sales.
Consider this: the likelihood of women purchasing a product plummets by 81 percent if the advertisement is riddled with spelling or grammatical errors. Similarly, 77 percent of men share the same sentiment.
But exceptional copywriting goes beyond impeccable grammar and thorough proofreading.
Effective copy should also:
- Educate
- Motivate
- Propel people to act
- Forge your brand’s voice
- Drive sales
These are lofty objectives to fulfill, yet accomplished copywriters can attain them, even within the confines of the most concise texts.
Varieties of copywriting
There are numerous instances of copywriting, each with a unique purpose. Even on this webpage, you can observe different styles of copywriting.
When mastering the art of copywriting, it’s crucial to familiarize yourself with these distinct types of copy.
Let’s explore some of these categories.
Brand copywriting
According to a survey, 70 percent of participants stated that brands should propagate positivity and disseminate uplifting stories. Brand copywriting is about discerning your audience’s desires and delivering the appropriate information with the right tone.
When you mention that you work in marketing, the usual assumption is that you’re involved in creating commercials, billboards, and jingles for prominent brands like Pepsi, Burger King, or Netflix.
However, the role of brand copywriters extends beyond these standard elements. They strive to evoke powerful emotional reactions. Creative copywriting is less about asserting a brand’s superiority over its competitors and more about crafting an unforgettable experience.
Copywriting for social media
As a brand, your objective in devising copy for social media platforms is to captivate audiences through posts and advertisements.
The tricky part of this style is tailoring your brand message to fit a variety of unique formats. For instance, the copy you compose for a Facebook post should not mirror that of your TikTok or Instagram posts.
However, social media copy remains focused on provoking action. Merely on Instagram, half the users have navigated to a website to make a purchase upon viewing it in Stories. This, however, will not transpire unless you can effectively persuade individuals to take action through this medium.
Here’s how you can master social media copywriting:
- Utilize potent verbs and active language to boost engagement.
- Aim for brevity. After all, social media thrives on concise communication.
- Maintain a friendly, conversational tone. Employ short sentences and avoid sounding overly formal or rigid.
- Craft attention-grabbing headlines.
- Incorporate relevant hashtags.
- Diversify your content. Don’t solely focus on selling. Engage, amuse, enlighten, and interact with your followers to foster relationships.
- Generate teaser content that divulges details about upcoming product launches, etc. Just bear in mind that this type of content may not appeal to everyone.
- Conclude with a compelling CTA, so your customer knows their next step.
- Be helpful and exude a human touch.
For instance, if you peruse Trello’s Twitter feed, you’ll find it brimming with product demonstrations, GIFs, pools and quizzes, hints, tips and other useful content, rendering it more personable and not just a corporate brand.
SEO copywriting
SEO revolves around the objective of achieving high rankings for your content on search engine result pages (SERPs).
SEO has been a tried-and-true method for driving targeted traffic to your products, and it continues to be a strong practice. Research indicates that in 2021, 69 percent of marketers invested in SEO, marking an increase from 64 percent the previous year.
To attain high rankings, your content must provide genuine value to users while incorporating relevant keywords and phrases thoughtfully. Essentially, you infuse your copy with vitality to meet specific keyword criteria.
Ranking well in search engines is an art, and businesses are making significant investments in this area. As a matter of fact, 71 percent of marketers identify capturing strategic keywords as their primary SEO tactic.
Here are a few SEO tips for your copywriting:
- Integrate keywords in your title and throughout the article, while avoiding excessive keyword stuffing.
- Ensure your article is well-written and informative, as quality content is more likely to be shared.
- Include links to other related articles on your website, enhancing your site’s ranking and driving more traffic.
- Incorporate images and videos whenever possible. They not only enhance the engagement of your content but also contribute to SEO efforts.
- Optimize your content for both readability and search engines.
- Craft attention-grabbing headlines that capture readers’ interest.
- Utilize strong call-to-actions to prompt readers to take the desired actions.
Insight copywriting
At its core, insight copywriting aims to position your brand as an authoritative presence within the industry. As a copywriter, you achieve this by creating high-value educational content.
Some audiences seek straightforward, comprehensive solutions to their primary pain points. For brands targeting a more experienced audience, thought leadership holds particular value.
According to research, 54 percent of decision-makers dedicate at least one hour per week to consuming thought leadership content, making it an effective means of reaching individuals who are inclined to take action.
Thought leadership content can be presented in various formats, including stories, expert interviews, blogs, or even a dedicated magazine.
For instance, Nutanix, a cloud computing company, leverages its online magazine called ‘The Forecast’ to provide a comprehensive exploration of cloud applications and their benefits. The magazine incorporates expert content, videos, and podcast links, solidifying Nutanix’s position as an authority in the field.

Email copywriting
Crafting an impactful email requires a distinct approach due to its unique format. However, mastering your copy can yield significant results, as email marketing boasts an average ROI of $36 per $1 spent.
To excel in email copywriting, consider these tips:
- Create captivating email subject lines that grab readers’ attention.
- Keep the copy concise while offering valuable content.
- Incorporate strong calls-to-action (CTAs) to prompt readers to take action.
- Request small commitments that resonate with your audience without alienating them.
Striking the right balance between these objectives can be challenging, but honing your copywriting skills will help you shape the perfect message.
Useful tools for copywriters
The age-old debate of whether humans or robots are better at copywriting is ongoing. While writing has traditionally been regarded as a human endeavor, modern technology offers significant assistance. Although relying solely on artificial intelligence (AI) for copywriting may not be ideal yet, leveraging the right tools can significantly enhance your copy’s performance.
According to marketers, 43 percent believe that more than half of their marketing tasks will be automated within the next five years. Copywriting elements undoubtedly fall within this projection.
How can you harness AI to enhance your campaigns? Consider the following tools to streamline your copywriting process, optimize your results, and hit the ground running.
Anyword
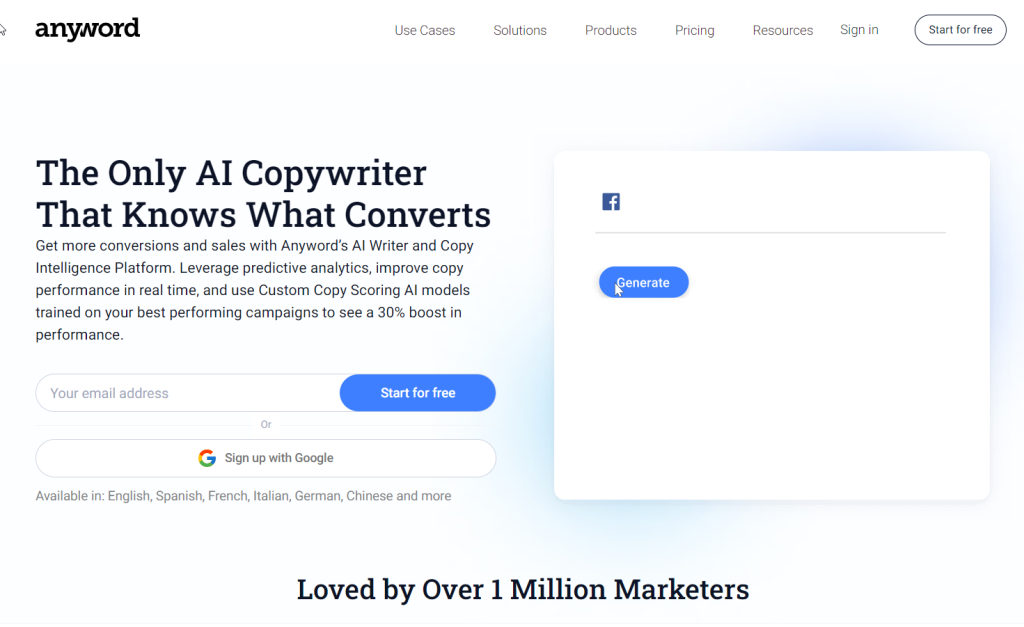
Even the most seasoned copywriters often find themselves unsure about the performance of their copy. However, artificial intelligence (AI) might hold the solution.
Data-backed copy is an effective way to add value and predictive analytics to your marketing decisions. It’s becoming increasingly common for copywriters to harness the power of data in order to craft and optimize smarter copy. Anyword is a prime example of this approach. It is a data-driven copywriting platform that utilizes predictive analytics to create and enhance marketing copy across various channels.
Anyword leverages the analysis of billions of data points to provide valuable insights on your copy. This enables you to select the most impactful words for your target audience, with minimal guesswork.
Sounds impressive, doesn’t it?
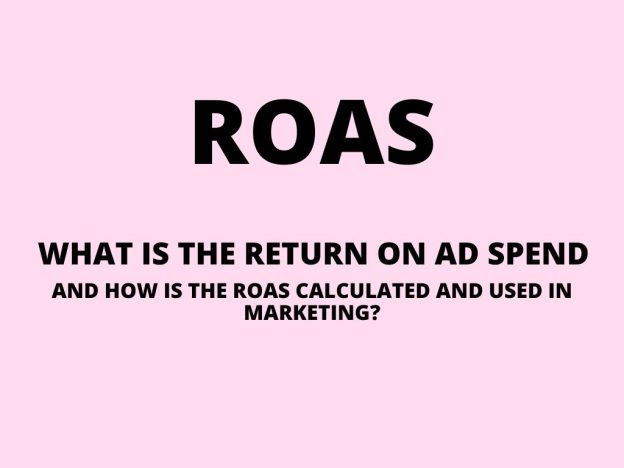
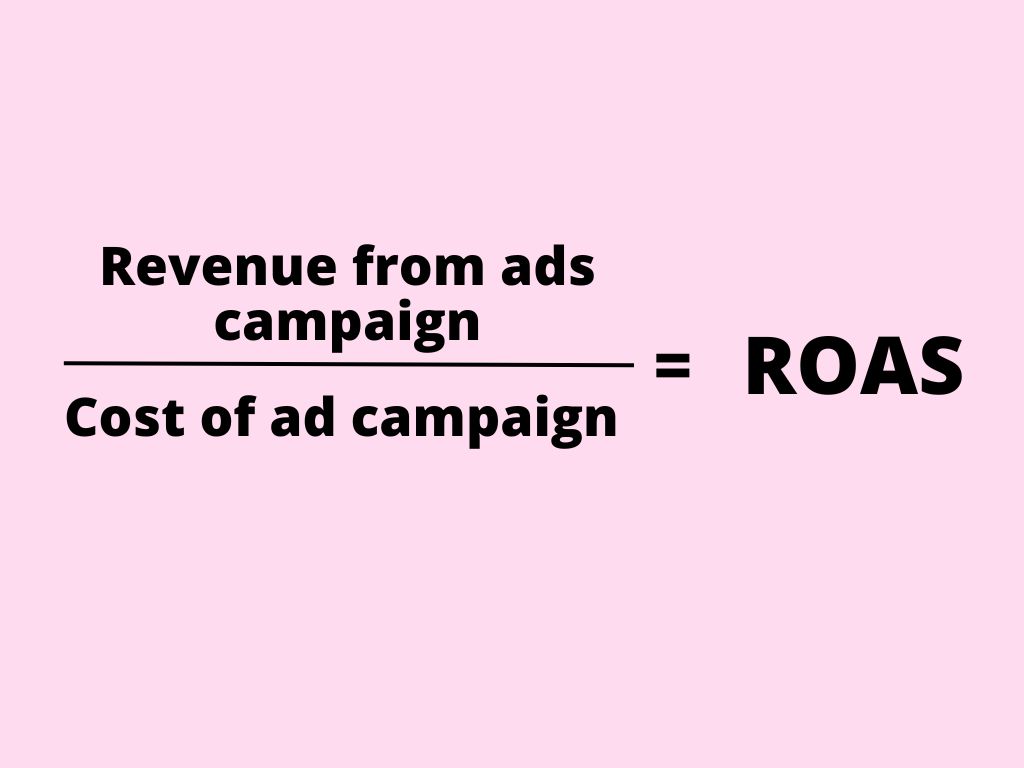
The insights delivered by Anyword’s analytics are incredibly valuable. They have been proven to increase conversions by up to 30 percent, and businesses like Ted Baker have experienced a remarkable 946 percent return on ad spend (ROAS).
Incorporating data into your content decisions can be challenging, but Anyword’s AI-based language models seamlessly integrate it into the writing process. Instead of spending time gathering data from multiple sources, you receive instant insights while crafting your copy, making it an invaluable tool.
Key benefits of Anywords
- Predictive performance score: Obtain an immediate assessment of your copy’s expected performance.
- Custom keywords: Incorporate relevant keywords that you want the AI to use.
- Content identification: Receive suggestions for the most effective content tailored to each revenue stream.
- Versatile copywriting: Anyword can assist in creating optimized content for various copy types.
Pricing of Anywords
- Free: Up to 1,000 words per month.
- Basic: $16 per month for up to 15,000 words/credits.
- Data-driven: $83 per month for up to 30,000 words/credits (2 months free with annual billing).
Grammarly
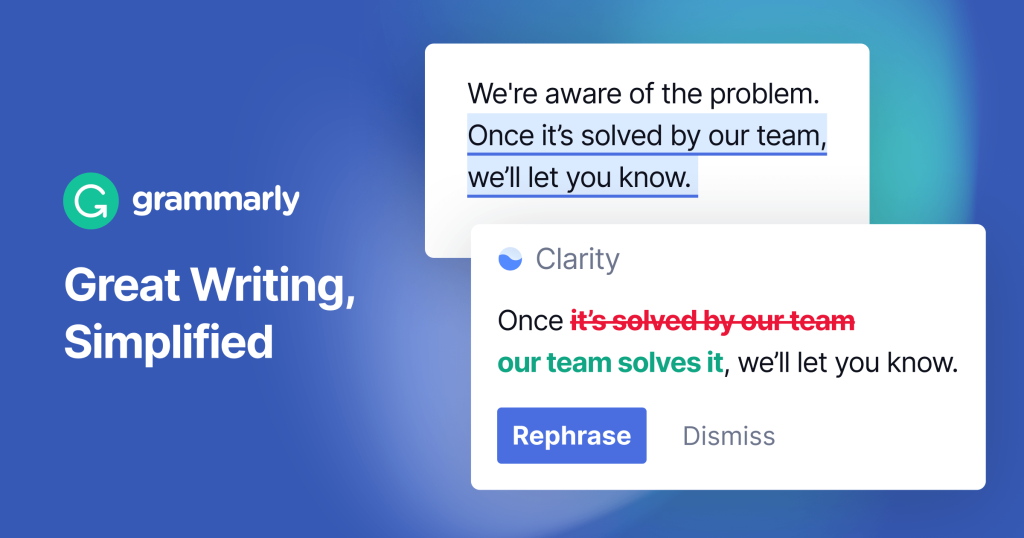
Even the most exceptional copy can be undermined by simple spelling and grammar errors. This is where Grammarly comes to the rescue. With over 30 million users worldwide, Grammarly is a trusted tool that can make a significant difference in your writing.
The easiest way to avoid errors is by using Grammarly’s free online writing tool. It automatically analyzes your text as you write, highlighting spelling and grammar mistakes.
Moreover, Grammarly offers a valuable feature that assesses the tone of your writing, allowing you to tailor your message to specific audiences.
While it’s still important to review your copy yourself, Grammarly serves as an excellent screening tool for a wide range of writing mistakes.
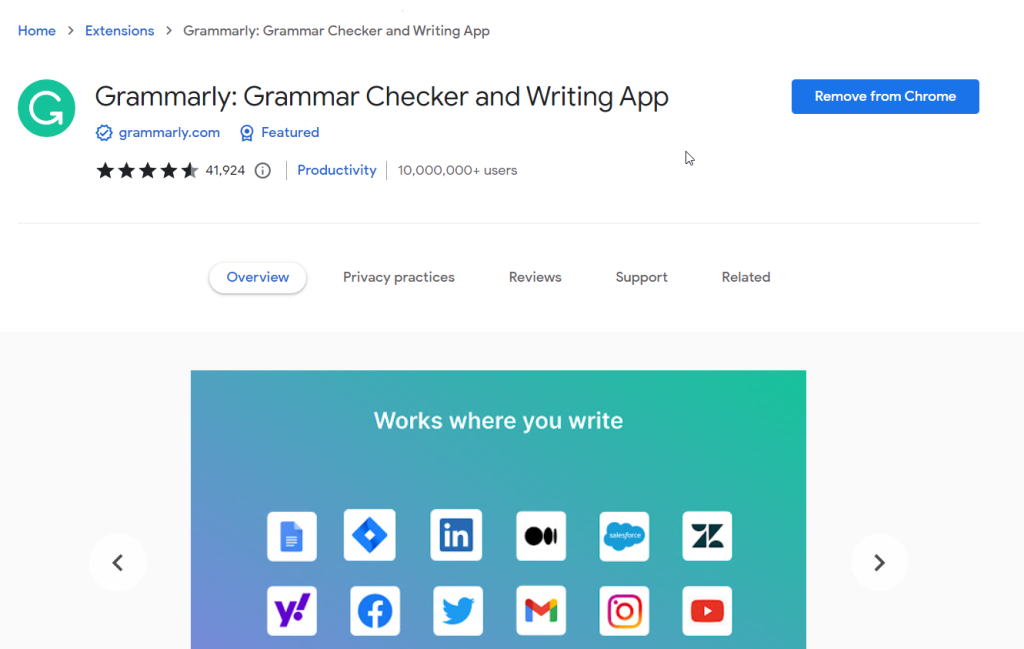
Grammarly offers a convenient Chrome plugin that seamlessly integrates with your web browser, allowing you to enhance your writing across various online platforms. With the Grammarly Chrome extension installed, you can access Grammarly’s powerful writing assistance directly within your browser, making it easier than ever to produce polished and error-free content.
Once you have the Grammarly Chrome plugin activated, it automatically scans your writing in real time, checking for spelling, grammar, and punctuation errors as you type. It instantly highlights any issues and provides suggested corrections, helping you catch mistakes and improve the overall quality of your writing. Whether you’re composing emails, writing social media posts, or crafting documents in Google Docs, Grammarly’s Chrome plugin ensures that your writing remains accurate and professional.
In addition to its grammar and spelling checks, the Grammarly Chrome plugin offers advanced features like tone detection and style suggestions. It analyzes your writing style and provides feedback on the tone and clarity of your message, helping you refine your writing to suit your intended audience. By leveraging Grammarly’s insights, you can adapt your tone, improve readability, and effectively communicate your ideas to readers.
The Grammarly Chrome plugin is highly versatile and compatible with a wide range of web-based applications and platforms. It seamlessly integrates with popular platforms like Gmail, Facebook, Twitter, LinkedIn, and many others. This means that wherever you write online, Grammarly is there to provide real-time assistance, ensuring your writing is error-free, engaging, and impactful.
With the Grammarly Chrome plugin, you can take advantage of Grammarly’s powerful writing assistance and improve your writing skills across the web. Whether you’re a professional writer, student, or someone who simply wants to communicate with clarity and precision, Grammarly’s Chrome plugin is a valuable tool that helps you write with confidence and professionalism. I highly recommend using this plugin, it will save you a lot of time.
Key benefits of Grammarly
- Effortless spelling and grammar: Receive high-level spelling and grammar recommendations as you write.
- Free plan functionality: The free version provides powerful features that are sufficient for most users.
- Tone and style suggestions: Receive immediate feedback on the tone of your copy and access style guides.
- Integration with various apps: Grammarly extensions are available for popular writing software such as Chrome, Google Docs, social media platforms, Outlook, and more.
Pricing of Grammarly
- Free: The limited but highly useful version is available at no cost.
- Premium: Starting from $12 per month, this plan offers more specific suggestions and enhanced capabilities.
- Business: Starting from $25 per month.
Wordtune

Refining your copy can be a time-consuming task. Wouldn’t it be great if you could type your initial thoughts and receive suggestions on how to make them even better?
That’s precisely what Wordtune offers.
Compose up to 280 characters, and this software will provide you with recommended rewrites to fuel your creativity. With the premium version, you can even adjust the tone, shorten or lengthen your copy according to your preferences.
While you remain in control of the ideas, Wordtune can help you enhance them.
Key benefits of Wordtune
- Instant rewrite suggestions: Type up to 280 characters and instantly receive rewrite suggestions.
- Shorten or expand suggestions (Paid): Obtain recommendations to shorten or expand your copy with a simple click.
- Switch between formal and casual tones (Paid): Receive rewrite suggestions based on a formal or casual tone.
- App extensions: Enjoy the convenience of plug-ins for various writing software such as Chrome, Google Docs, social media platforms, Outlook, and more.
Pricing of Wordtune
- Free: 10 rewrites per day.
- Premium: $9.99 per month for unlimited rewrites.
- Premium for teams: Inquire on the website.
How to write – copywriting strategies
We have answered the question “What is copywriting?” and highlighted some tools to elevate your content, but what about strategies?
Even with the best copywriting software at your disposal, the human element is crucial. What steps can you take to ensure your words inspire people to take action?
Prioritize understanding of your audience
While privacy concerns are prominent, studies show that 65 percent of consumers are willing to share their data for a personalized experience. In a data-conscious world, individuals are open to sharing personal information if it means receiving tailored information, recommendations, and offers.
This emphasizes the importance of understanding your target audience. When you have a clear understanding of whom you are writing for, you can adapt your approach to meet their preferences, desires, and needs.
But how do you gain this understanding? By creating a buyer persona, which is a fictional representation of your ideal customer. A buyer persona outlines key demographics, job titles, locations, ages, income levels, and other relevant details about your audience.
Don’t approach this task haphazardly. Delve into your existing customer data and identify customers with a high lifetime value or retention rate.

Once you have your buyer persona defined, dive deeper by asking yourself pertinent questions such as:
- Who are your current customers?
- Who would you like to target as customers?
- What aspects of your offering do your current customers appreciate?
- What challenges do your customers face, and how do you assist them in overcoming those obstacles?
Utilize this information as a guiding compass as you embark on your copywriting journey.
Remember that effective copywriting directly appeals to your target audience, so employ language that resonates with them. Involve them in the process by incorporating “you” and “we” references.
For instance, consider the distinction between these two sentences:
- AI tools can enhance conversion rates.
- AI tools can help you increase your conversion rates.
By slightly adjusting the language, you transform it into a more personalized suggestion.
To assist you in creating a customer persona, here’s a link to a free template.
Use the appropriate tone (of voice)
Writing well entails more than just selecting the right words. Tone, or the attitude reflected in your writing, provides significant context beyond the choice of words. It conveys to prospective customers whether you are fun-loving, serious, quirky, or highly professional.
For example, let’s consider two copywriting examples for a fictional company that sells sales software:
“Achieve a deeper understanding of your customers using our cutting-edge software designed to catapult your business from zero to hero.”
This example maintains a professional tone while highlighting the software’s key benefits (advanced features and customer understanding). It also incorporates a hint of quirkiness with the phrase “zero to hero,” demonstrating a light-hearted approach.
Now, let’s explore the second example:
“Gain an in-depth understanding of your customers with our AI-powered sales software. Selling ONEPlus software streamlines your sales funnel and drives revenue.”
Both examples convey similar information, but the tone differs. The second example adopts a more professional tone and delves deeper into the benefits, emphasizing the utilization of AI technology to enhance the sales process. This tone is better suited for C-suite executives or enterprise-level companies.
Although the information remains essentially the same, the tone is adjusted based on the target audience. It helps customers feel that they are in the right place and that the software is an ideal fit for their business.
Here’s another example of the effect tone can have – you can easily grab different target groups as Vodafone did.
The tone of your copy is what sets it apart; it captures your attention. It’s not about using fancy words, but rather how they are used to engage the reader.
If finding the right tone is a challenge, here’s some good news. Grammarly offers a built-in tool that helps you adjust your writing tone to align with your target audience.
For instance, if you select a “general” audience, the tool will identify complex sentences that may be difficult for a general audience to comprehend.
Emphasize your UVP (Unique Value Proposition)
The internet and the globalization trend have provided us with an abundance of options. Online sales are continuously on the rise, with a notable 14.2 percent increase in the U.S. alone. People are increasingly turning to online platforms for their buying and selling needs.
For example, when searching for a new mattress, you are no longer limited to the options available at two local furniture stores. Now, you can choose and order a mattress from anywhere in the world and have it conveniently delivered to your doorstep within days.
Having more options is advantageous for consumers. However, for businesses, the proliferation of choices means increased competition. This is why your copy must focus on highlighting what sets you apart from your competitors — your Unique Value Proposition (UVP).
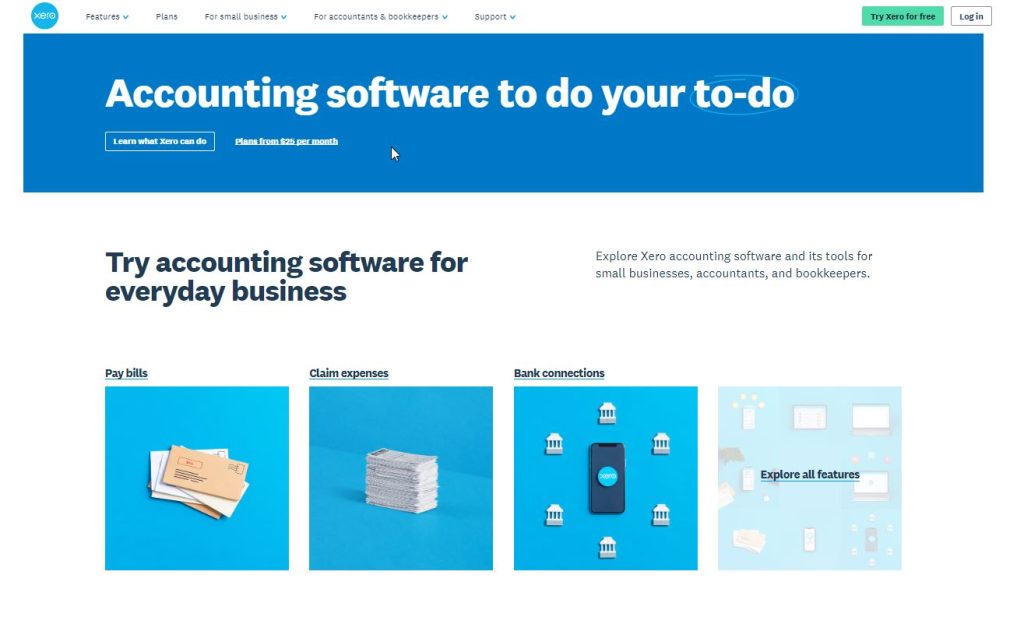
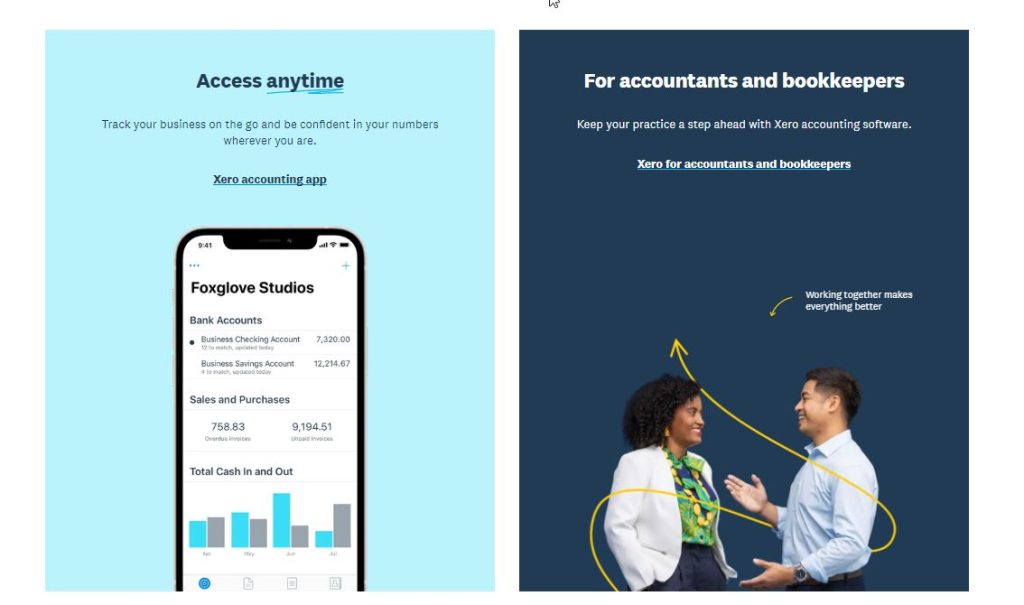
Xero excels at effectively showcasing the value proposition of its software. In just four words, it succinctly describes what the tool accomplishes: “simplify everyday business tasks.” Additionally, it clearly specifies the target audience for whom the software is designed: “small businesses, accountants, bookkeepers locally and around the world.”
Let’s face it: Your business isn’t meant to cater to everyone, and that’s perfectly fine!
Perhaps your focus is on helping small businesses with their social media marketing or providing software specifically designed for free-range chicken farmers to track egg production. Your Unique Value Proposition (UVP) should be laser-focused on explaining why you are the perfect fit for your specific target audience, rather than trying to appeal to everyone.
For instance, small businesses often operate on a smaller budget and may prioritize organic growth overpaid social advertising. Free-range egg farmers might require sensor technology that covers a wider area compared to conventional factory farms.
Remember, you don’t have to excel in every aspect. Instead of trying to highlight all the incredible things you can do, take the time to identify and emphasize what sets you apart.
Once you’ve determined your UVP, there are some excellent free templates available online to help you craft a compelling message.
The power of storytelling
An Authencity Gap Study conducted across 300 brands and five categories emphasizes the importance consumers place on authenticity and transparency. To effectively engage your audience, it’s crucial to back your claims with real-world data and examples.
Throughout history, storytelling has been a powerful tool for achieving various goals, and it’s an approach I personally employ.
I understand that blogging has the potential to build a seven-figure business, but it becomes even more impactful when I share the story of how I used content to achieve that success. Why is storytelling so effective?
- It’s more entertaining.
- Stories are easier to remember than mere facts.
- They provide context and help us make sense of information.
- We enjoy sharing stories with others, making them more likely to be passed on.
- A good story transcends time.
Consider this article as an example. While discussing a serious topic, I intersperse it with small stories. Notice how I didn’t use an example of a faceless business in the previous section? Instead, I chose a story that illustrates how farmers can track their chickens’ egg production.
I aim to paint a vivid picture in your mind, showcasing why the egg-tracking software needs to demonstrate its value proposition and how it contributes to generating sales.
You don’t have to narrate your entire history, but you can incorporate the principles of storytelling into virtually any form of copywriting.
Even better, real-life stories that inspire action can be incredibly impactful.
By leveraging the power of storytelling, you can captivate your audience and motivate them to take action.
Use pain points in your copywriting
Account-based marketing is a valuable approach used by 70 percent of marketers to identify individuals’ pain points. However, the effectiveness of addressing pain points extends beyond a specific audience and can be applied to a broader target market. Achieving this requires skillful copywriting.
Effective copywriting goes beyond highlighting the positive aspects of your product or showcasing customer satisfaction. It should primarily address the pain points of your target audience—the problems they are seeking solutions for.
When writing copy, it’s crucial to understand that customers are not simply looking for a product or service because everything is perfect. They have specific challenges or pain points that they want to overcome. By focusing on these pain points, you can effectively engage your audience and demonstrate how your offering provides the solution they need.
When crafting your copy, ensure that you highlight how your product or service directly addresses the pain points of your target audience. By emphasizing the benefits and features that help them overcome their challenges, you can effectively communicate the value you provide and capture their attention.
Remember – customers are seeking solutions to their problems. By aligning your copy with their pain points, you can establish a connection and position your product as the ideal solution they are looking for.
When it comes to addressing your customer’s needs, it’s essential to understand the specific pain points they experience. Here are six common pain points that customers often face:
- Financial – customers may be concerned about the cost or affordability of a product or service. Or about the return on investment (is it really worth that price?). Financial considerations are a significant factor for customers as they evaluate a product or service. Affordability and return on investment (ROI) play crucial roles in their decision-making process. Customers want to ensure that they are making a sound financial investment and receiving sufficient value in return. The cost of a product or service is a primary concern for customers. They want to know if the price aligns with their budget and if the benefits they will receive justify the investment. Customers are often wary of overspending or feeling like they are not getting their money’s worth. They seek transparency in pricing, competitive pricing compared to similar offerings in the market, and clear explanations of the value they will receive. Customers also assess the potential ROI when considering a purchase. They want to know if the product or service will deliver tangible benefits that outweigh the financial investment. They may weigh factors such as increased productivity, cost savings in the long run, or improved outcomes against the initial price. Customers look for evidence, testimonials, or case studies that demonstrate the value and ROI others have experienced.
To address financial concerns in your copywriting, it’s important to communicate the value proposition and benefits of your product or service. Clearly articulate how your offering provides a favorable ROI and outweighs the cost. Highlight any cost-saving features, competitive pricing, or unique advantages that make your offering a financially wise choice. By addressing customers’ financial concerns head-on and demonstrating the value they will receive, you can build trust and confidence in your offering.
- Risk and trust – building trust and alleviating concerns about risks associated with a purchase are important for customers. The risk could be connected with warranty or reclamation services or a money-back guarantee – will this small and unknown company really send me money back? Is this not a scam? Trusted companies have an easier job to convince users to buy or buy again the product from the same company.
- Ease and convenience – customers value simplicity and convenience in their interactions with a product or service. Is the product easy to use? Are there any possible barriers or obstacles they need to overcome? An example could be – imagine you need to buy a modem and you do not know whether it will work at your home. Do you probably need to setup it on your own? Will you be successful? Maybe yes and maybe not. And imagine the product itself has a description stating that this modem is compatible with any household internet cables and setup is done via a separate modem manager/program – it is done with just 2 clicks.
- Productivity and time – productivity and time are significant concerns for customers as they strive to make the most out of their busy lives. In today’s fast-paced world, people are constantly seeking ways to streamline their tasks and optimize their efficiency. They want solutions that can help them save time and accomplish more within limited resources. Customers are often looking for products or services that offer automation, streamlined processes, or tools that can simplify complex tasks. They value solutions that can help them complete their work faster, freeing up time for other important activities or allowing them to achieve a better work-life balance. For example, in the realm of project management software, customers seek platforms that provide intuitive interfaces, collaboration features, and task management tools that enable them to efficiently organize and track their projects. By using such tools, they can streamline their workflows, enhance team collaboration, and ultimately save valuable time. By understanding the pain point of productivity and time, you can emphasize how your offering addresses these concerns. Whether it’s through time-saving features, automated processes, or streamlined workflows, highlighting how your product or service optimizes productivity can resonate with customers who value efficiency and seek ways to make the most of their time.
- Processes and journey – they are critical considerations for customers as they expect seamless and hassle-free experiences when interacting with a product or service. From the initial discovery phase to the final purchase and beyond, customers desire a smooth and well-defined journey that minimizes friction and enhances their overall satisfaction. Customers appreciate companies that prioritize user-friendly interfaces, intuitive navigation, and clear communication throughout the entire customer journey. They want to feel supported and guided at every step, whether it’s exploring product options, making a purchase, receiving updates on their order, or seeking assistance post-purchase. Any roadblocks or complexities in the process can lead to frustration and may even result in customers abandoning their journey. To meet customer expectations in this regard, companies invest in optimizing their processes and designing customer-centric journeys. They map out the various touchpoints and interactions customers have with their brand and strive to enhance each stage. This includes simplifying registration or onboarding procedures, providing transparent pricing and shipping information, offering responsive customer support, and continuously improving the overall user experience. By recognizing the importance of processes and journeys, you can ensure your copywriting addresses these concerns. Emphasize the seamless experience customers can expect, highlight the simplicity of your processes, and communicate how you prioritize their journey from start to finish. By providing a smooth and hassle-free experience, you can differentiate your brand and build trust and loyalty with customers.
- Communication and support – effective communication and reliable customer support are vital components of a positive customer experience. Customers value companies that prioritize clear and timely communication, as well as provide accessible and efficient support channels to address their concerns and inquiries. In today’s digital age, customers expect seamless communication across various channels, including phone, email, live chat, and social media. They want their questions and concerns to be addressed promptly and accurately. Companies that excel in communication understand the importance of active listening, empathetic responses, and providing relevant and helpful information. Additionally, reliable customer support is crucial in ensuring that customers feel supported throughout their journey. When they encounter issues or have questions, they want to have confidence that assistance is readily available. This includes prompt response times, knowledgeable support representatives, and effective problem-solving. Customers appreciate companies that go the extra mile to resolve their issues and provide personalized support. To address communication and support concerns in your copywriting, emphasize the availability and accessibility of your customer support channels. Highlight your commitment to responsive communication and the expertise of your support team. Showcase any unique features, such as 24/7 support or dedicated account managers, that demonstrate your dedication to providing exceptional customer service. By assuring customers that their concerns will be heard and addressed promptly, you can foster trust and loyalty.
By understanding these pain points, you can tailor your copy to demonstrate how your offering directly addresses and resolves these customer concerns. To gather insights about your customer’s pain points, consider conducting surveys or engaging in direct communication with your audience. By actively listening to your customers’ feedback, you can gain valuable information that enables you to craft compelling copy that speaks to their needs and positions your product or service as the solution they are seeking.
Leveraging social proof
Leveraging social proof is a powerful strategy in copywriting, especially in today’s digital landscape where online reviews carry significant weight. With 77 percent of people reading reviews before making a purchase decision, incorporating social proof into your copy is crucial to establish trust and credibility with your audience.
The effectiveness of social proof lies in our innate tendency to rely on the experiences and opinions of others. When we see that someone else has had a positive experience with a product or service, we naturally want to enjoy the same benefits. We tend to trust information that comes from fellow consumers, such as family members, friends, or even online reviewers, more than information directly provided by brands themselves.
For example, when you’re looking for a new Indian restaurant, you’re more likely to trust the recommendation of your best friend than an ad you saw on Facebook. This is because personal recommendations and reviews carry a higher level of trust. In fact, studies have shown that 79 percent of consumers trust online reviews as much as personal recommendations from family or friends. On the other hand, traditional advertising mediums like TV and print ads are perceived as less trustworthy by an average of 46 percent of U.S. consumers.
To leverage social proof in your copywriting, consider the following strategies:
- Use social proof to inspire your copywriting – reviews and customer surveys can provide valuable insights into what customers love about your product or service. Incorporate these positive aspects into your copy to address the pain points and highlight the benefits that resonate most with your target audience.
- Include social proof near your copy – display reviews, testimonials, and case study prominently on your landing pages, homepages, and other relevant sections of your website. By showcasing real-life experiences and positive feedback from satisfied customers, you strengthen your copy and provide social validation that others have had a positive experience with your offerings.
By incorporating social proof effectively, you not only build trust but also create a sense of credibility and reliability for your brand. Customers are more likely to feel confident in their decision to choose your product or service when they see that others have had a positive experience. So, leverage social proof strategically to make you’re copywriting more powerful and compelling.
Use crisp or concise language
Did you know that the average human attention span is often said to be about 8 seconds? It may sound shocking, but it’s important to understand that attention spans can vary depending on the task at hand. When it comes to browsing the internet, people are typically looking for quick access to important information and insights, without wasting time on unnecessary fluff.
In the world of copywriting, being concise is key. While in other forms of writing, such as emails or blog posts, a more elaborate style may be acceptable or even preferred, copywriting requires a different approach. Every word in your copy needs to have a purpose. It should educate, emphasize a benefit, or establish a connection with your audience. Anything that doesn’t serve these objectives should be eliminated.
To help you write more impactful copy, here are a few common words and phrases to avoid using:
- Unnecessary adjectives – while descriptive words can enhance your writing, using too many can dilute the impact of your message. Choose the most relevant and powerful adjectives and discard the rest.
- Filler words – words like “very,” “really,” “extremely,” and “quite” often add little value to your copy. Instead, opt for stronger and more precise words that convey your message directly.
- Redundant phrases – phrases like “in order to,” “due to the fact that,” and “at this point in time” can be simplified and made more concise. Focus on conveying your message in a clear and straightforward manner.
- Jargon and technical terms – unless your target audience consists of experts in a specific field, avoid using excessive jargon or technical terms that may confuse or alienate your readers. Opt for plain language that is easily understandable to a wider audience.
Remember, the goal of copywriting is to capture and hold the attention of your readers, delivering a clear and persuasive message. By using concise language and eliminating unnecessary fluff, you can create copy that is impactful, engaging, and effective.
In the quest for clear and impactful copy, it’s important to be mindful of certain words and phrases that can weaken your message. While these words may have their place in certain contexts, it’s essential to evaluate whether they truly contribute to the effectiveness of your copy.
Here are some words and phrases to be cautious about:
- “That“: This word often serves as a filler and can often be removed without changing the meaning of a sentence. Consider whether its presence adds clarity or if the sentence works well without it.
- “In order to“: This phrase can often be simplified to “to” without sacrificing the meaning. Streamlining your language helps maintain a concise and direct tone.
- “Maybe,” “perhaps,” and “just“: These words can introduce uncertainty and weaken the impact of your statements. Be intentional with your language and strive for confidence and conviction.
- “Very,” “really,” and “a little“: While these adverbs can sometimes be useful for emphasis, they are often overused and can dilute the strength of your message. Look for opportunities to replace them with more powerful and specific words.
- “Even,” and “just“: These words can sometimes be unnecessary and add clutter to your sentences. Consider whether they contribute to the clarity or impact of your message and remove them if they don’t.
- “So“: While “so” can serve a purpose in certain contexts, it can also be overused and become repetitive. Ensure that its inclusion enhances the meaning of your sentence.
- “Of” (very overused): Pay attention to instances where “of” is used excessively, as it can sometimes be eliminated or replaced with more concise alternatives.
- “Like“: While “like” can be appropriate in certain comparisons, be mindful of its usage. Consider whether a more precise word or phrase can better convey your intended meaning.
To enhance the quality of your copy, consider using tools like the Hemingway App, which can help identify complex sentences and phrases. By eliminating unnecessary filler words and replacing them with impactful alternatives, you can create copy that is clear, concise, and compelling.
Test your copy for optimal and better results
Here’s an intriguing statistic for you: Back in 2010, Barack Obama utilized A/B testing to generate an additional $60 million for his fundraising efforts. While A/B testing and its related concepts were relatively new at the time, it’s surprising to see that many people today still underutilize this powerful tool.
Copywriting is an iterative process, and one crucial step in the journey is determining what truly resonates with your target audience. Regardless of how much research you conduct or how well you understand your audience’s preferences, it’s essential to put your copy to the test through A/B testing.
I’m consistently amazed by the insights gained from A/B testing in copywriting. Sometimes, different customer segments have distinct pain points, while other times, a minor adjustment in tone can make a significant difference.
Moreover, consumer tastes and preferences evolve over time. Consider the use of AI in your copy. A few years ago, this may have held little meaning to customers. However, today, AI is ubiquitous across various brands’ copy. By conducting A/B tests, you could have identified the winning approach ahead of the competition.
Even brands that may seem unlikely candidates are now integrating AI into their copy. The reason behind this shift is simple—they have tested it and discovered that it works.
By engaging in A/B testing, you unlock valuable insights that allow you to fine-tune your copy and optimize its impact. Don’t miss out on the opportunity to leverage this powerful tool and ensure your copy resonates with your audience, drives engagement, and achieves your desired results.
However, there’s one crucial aspect to keep in mind—when conducting A/B tests, avoid testing drastically different versions of your copy. Instead, focus on testing one or two element changes at most to identify the most impactful modifications that drive conversions. Once you’ve determined the most successful version, continue testing and refining.
Consider running tests on the following elements:
- Point of view – compare phrases like “You can save” versus “Save now” to gauge their effectiveness.
- Button copy – test variations such as “Buy Now,” “Get your free account,” or “Sign up.”
- Headlines – experiment with different approaches that emphasize various features or pain points.
- Formatting – compare the use of bullet points versus numbered lists to see which enhances readability and engagement.
- Call-to-Actions (CTAs) – test multiple CTAs to determine the language and design that drive the highest action rates.
A/B testing tools like Google Optimize and Optimizely can simplify the process of testing and analyzing your copy’s performance.
Remember, A/B testing should be an ongoing practice to continuously refine and optimize your copy over time. Avoid conducting just one or two tests and consider the job done.
Is it a good idea to use AI for copywriting?
Using AI for copywriting can be a good idea depending on the specific situation and needs, but it’s also important to remember that it comes with its own set of advantages and limitations. Here’s a more detailed look at this.
Advantages of using AI in copywriting:
- Efficiency – AI can produce copy quickly, saving time, especially for repetitive or formulaic writing tasks. It can be used to generate product descriptions, ad copy, social media posts, and other types of content on a large scale.
- Cost-effectiveness – AI can help businesses save money in the long run, especially when they need to produce a lot of copy, and hiring full-time writers might be cost-prohibitive.
- Consistency – AI can maintain a consistent brand voice and style throughout all pieces of content, reducing the risk of inconsistencies that may arise with multiple human writers.
- Personalization – AI algorithms can create personalized content for individual users based on their behavior, preferences, and other data.
- Analytical abilities – AI can analyze vast amounts of data and produce insights that can inform copywriting strategies. Moreover, when ChatGPT-4 can now browse the internet, it brings even more potential.
Limitations of using AI in copywriting:
- Creativity – while AI has come a long way, it still has trouble matching human creativity. AI generally works by analyzing existing content and producing similar results, which can limit its ability to come up with truly unique and engaging content.
- Lack of deep understanding of topics – AI, as advanced as it is, still doesn’t fully comprehend the depth and nuances of human language. As a result, the content it produces may not always align with the actual intent of the keywords or phrases, which is increasingly important for modern SEO.
- Understanding context – AI might not fully understand cultural nuances, humor, or other context-specific elements. This can lead to awkward or inappropriate copy.
- Ethics and privacy – using AI for copywriting involves collecting and analyzing user data, which can raise concerns about privacy. Additionally, AI-generated copy could potentially be used in misleading or unethical ways.
- Need for supervision – while AI can generate copy, the copy often still needs to be reviewed and edited by humans to ensure its quality and appropriateness.
- Lack of emotional intelligence – AI doesn’t possess emotional intelligence. It doesn’t understand emotions the same way humans do, and this could potentially affect the emotional impact of the copy.
Therefore, while AI can be an effective tool for copywriting, it should ideally be used in conjunction with human writers and editors to ensure the best results. As AI continues to improve, its advantages for copywriting will likely increase, but it’s unlikely to completely replace human copywriters in the near future.
Other factors why not to use just AI for copywriting – SEO
AI copywriting tools do have several strengths, but there are also some specific limitations that can impact their performance with regard to SEO (Search Engine Optimization):
- Keyword stuffing: Some AI tools, in an effort to optimize content, may overuse target keywords, leading to “keyword stuffing.” This practice can actually harm SEO as search engines like Google penalize content that appears to be manipulating their algorithms.
- Originality and quality: AI typically generates content based on existing data. It’s possible that the resulting content might not be as original or high quality as what a human could create. Search engines prioritize unique, high-quality content in their rankings, so this could potentially affect SEO.
- Engagement: While AI can create technically sound content, it might not always engage readers in the same way a human writer can. Factors like readability, relevance, and emotional resonance are crucial to keeping users on a page, which in turn is a positive signal for SEO.
- Semantic SEO: This refers to creating content that deeply understands and answers users’ search queries. AI might struggle with semantic SEO because it doesn’t yet understand the context in the same way humans do.
- Ever-changing SEO practices: SEO is a dynamic field that’s constantly evolving. Search engines regularly update their algorithms and ranking factors, and keeping up with these changes requires human insight and adaptability that AI doesn’t possess.
This does not mean that AI can’t be useful in SEO. It can be a powerful tool for keyword research, competitive analysis, and optimization of meta tags and descriptions, among other tasks. The key is to use AI as a complement to human skills and judgment, rather than as a complete replacement.
Use engaging facts and statistics
Facts and statistics have a remarkable ability to capture attention and tell a compelling story. Just look at the number of stats I’ve included in this article! They add credibility and strengthen the points being made.
When making claims or assertions in your copy, backing them up with data is essential for earning trust and credibility. Simply stating that a certain strategy or tool is important might not be convincing enough. However, when supported by concrete data, such as the percentage increase in sales experienced by companies that implemented A/B testing, it becomes much more compelling.
In copywriting, where brevity is key, stats are like gold dust. They pack a punch and can quickly sway readers to take action. Take, for instance, the email marketing software company Drip. They highlight that over 30,000 marketers are already using their software, providing social proof of its effectiveness. Furthermore, they provide specific examples of companies that have achieved impressive results, such as driving over $1 million in revenue or experiencing a 30 percent increase in average orders through the use of their software.
By incorporating engaging facts and statistics into your copy, you not only enhance its credibility but also create a sense of urgency and desirability that motivates readers to act.
Cold, hard statistics have a powerful impact and can effectively cut through the noise, instantly capturing the attention of site visitors.
Repeat key information
Experts suggest that to make information memorable, it needs to be actively recalled around 30 times. While repeating the exact same phrase 30 times in your copy might not be practical, it is important to reinforce key information throughout your content. By doing so, you ensure that important details are not easily overlooked and instead stand out in the reader’s mind.
Let’s take a look at a few examples, all taken from the same homepage:

You might not catch the idea that Allbirds’ shoes are sustainable the first time it’s mentioned, and you might even miss it the second time. However, by the third mention, it becomes clear that sustainability is a key feature of Allbirds’ shoes.
When it comes to incorporating keywords or themes into your copy, it’s crucial for them to flow naturally within the text. Just like fluff, inserting keywords or themes for the sake of it can hinder the effectiveness of your copywriting.
Instead, focus on highlighting the ideas that hold the most significance for your target audience and repeat them in a way that feels organic and seamless.
Engage readers with questions in your copy
In real-life conversations, it’s not often that we engage in one-sided discussions. Communication is typically a collaborative process. Similarly, when you’re aiming to prompt action from your readers, you need to involve them in the conversation.
Skilled copywriters often utilize questions for this very reason. Why? Because asking questions fosters collaboration and encourages readers to connect the dots. When I asked you why top copywriters use questions, what happened in your mind?
Chances are, your brain started actively seeking answers. We are naturally inclined to find solutions to questions, and this innate response helps us form a deeper connection with the copy we’re reading.


Apart from the clever wordplay between “hairstyle” and “air style,” this copy naturally stimulates your brain to seek an answer to the question posed.
The primary objective of exceptional copy is to engage readers because, without their attention, it’s challenging to inspire action. Incorporating a question into your copy is an effective method to achieve this.
Use compelling words in your copy
Every language contains certain words that trigger a psychological or emotional response. These words are commonly known as power words, and they are pervasive in the field of copywriting.
Although we may not be consciously aware of it, these words have the ability to persuade us to take action, making them a valuable tool for copywriters.
Consider some of the familiar phrases we encounter in advertisements:
“Get rich quick” “While supplies last” “Last chance” “Buy now, pay zero”
These phrases leverage powerful words that have been proven to evoke specific emotions, and you can harness their power to inspire action.
During your split testing, try incorporating one of these power words into your copy and observe the impact. Adding just a couple of these words to a pop-up has been shown to increase sign-ups by more than 400 percent.
It’s almost like a Jedi mind trick, except anyone can utilize it to enhance their copywriting.
Here we see some of those compelling words in action:
- convert
- monetize
- instantly
- grow
- powerful
- optimization
It’s a short piece of copy, and yet, so many of those words pack a real punch.
FAQs – Comprehensive copywriting guide
- What’s the difference between copywriting and content marketing? Copywriting is the art of using written text to inform and persuade readers to take action, while content marketing encompasses a broader range of content that aims to achieve similar goals. Marketing emails, social media posts, and other written materials all fall under the umbrella of copywriting.
- What does a copywriter do? A copywriter specializes in creating persuasive ad copy, compelling web content, and other marketing materials. They are skilled at crafting catchy slogans, attention-grabbing headlines, and persuasive sales copy.
- How do you become a copywriter? Becoming a copywriter doesn’t require specific qualifications. What you need are strong writing skills and the ability to understand how to inspire your target audience to take action.
- What skills do copywriters need? Copywriters need to possess a combination of skills, including exceptional writing abilities, research skills, analytical thinking, effective communication, and problem-solving capabilities. Copywriters need to understand the desires and needs of their target audience and create messages that resonate with them. They must also craft effective calls to action. Other essential skills include a comprehensive understanding of common advertising and marketing concepts, strong writing abilities, and the capacity for creative and strategic thinking.
- How do you measure the success of your copywriting? The success of copywriting is measured by the number of people who take the desired action as a result of the copy. The metrics used to evaluate success may vary depending on the specific type of copy being written, but it’s crucial to have a clear goal and a method for measuring performance against that goal.
- How much money do copywriters make? According to Glassdoor, the average total pay for a senior copywriter is estimated to be $92,105. This aligns closely with the Bureau of Labor Statistics’ annual salary estimate of $69,510 for all writers, which includes copywriters.
- Is it a good idea to use AI for copywriting? AI can be an effective tool for copywriting, it should ideally be used in conjunction with human writers and editors to ensure the best results. As AI continues to improve, its advantages for copywriting will likely increase, but it’s unlikely to completely replace human copywriters in the near future. While AI can generate copy, the copy often still needs to be reviewed and edited by humans to ensure its quality and appropriateness.
Conclusion
Copywriting plays a crucial role in the realm of digital marketing. Convincing people to take action is essential for generating website clicks, generating leads, and driving sales.
Fortunately, copywriting is a skill that can be learned and honed with the right focus. By applying the tips and utilizing the tools provided, you can master the art of copywriting and leverage this newfound skill for your own business or explore opportunities to work as a professional copywriter. The choice is yours.