
What is Google Analytics 4? GA4 vs. Universal Analytics: A side-by-side comparison and how does it differ from Universal Analytics? 2.part
In the first part of our exploration and tour of the past, we dived into the fascinating journey of Urchin, tracing its evolution from a pioneering analytics tool to its pivotal role in the creation of Google Analytics. This story highlighted key milestones, from Urchin’s early days and its acquisition by Google, to the transformative steps that led to the development of Google Analytics as a dominant force in web analytics.
In the next part of our story, we’re going to look at the newest big change in Google Analytics: the start of Google Analytics 4 (GA4). We’ll make GA4 easy to understand. We’ll explain what it is and how it’s different from the older version, Universal Analytics. We’ll compare GA4 and Universal Analytics, pointing out what’s new and better in GA4. This includes how it handles data, respects privacy, tracks users, and uses smart technology for deeper insights.
This section is not just about the technical side of GA4. We’ll also talk about what these changes mean for businesses and marketers. How will moving to GA4 affect them? What challenges might they face, and what new changes could they bring in this fast-changing digital world?
Let’s dive into Google Analytics 4 together and see how it’s changing the game in understanding website data.
Google Analytics shift to Universal Analytics
Post-acquisition, Google utilized the foundation laid by Urchin to develop what would become one of the most popular web analytics services worldwide. Urchin’s technology and insights were instrumental in the creation of Google Analytics, a platform that has since become a staple for webmasters, marketers, and businesses looking to gain insights into their online presence and performance.
Following the acquisition, Google set out to transform Urchin on Demand into a more accessible and powerful web analytics tool. In November 2005, Google launched the first version of Google Analytics. This launch marked a significant moment in the web analytics industry, as it made robust analytics tools available for free to webmasters and marketers worldwide. The initial release was so popular that Google had to temporarily halt new sign-ups due to overwhelming demand.
The early versions of Google Analytics focused primarily on providing insights into website traffic, such as page views, session durations, and bounce rates. It was a tool designed to help website owners understand how visitors interacted with their sites. This data was crucial for businesses and marketers to optimize their websites for better user engagement and conversion rates.
Over the years, Google Analytics underwent several updates to enhance its functionality and user interface. These updates included improved goal tracking, e-commerce reporting, and the introduction of custom reports, which allowed users to tailor their data analysis more closely to their specific needs.
In 2007, Google introduced a major update with the launch of Google Analytics v2. This version featured a completely redesigned user interface, making it more user-friendly and visually appealing. The update also included new features like internal site search tracking and event tracking, which provided deeper insights into user behavior on websites.
Another significant development came in 2009 with the introduction of real-time analytics, enabling users to see active visitors on their site and their activities in real-time. This feature was a game-changer for immediate data analysis and decision-making.
Despite these advancements, the digital landscape was rapidly evolving, with the rise of mobile devices and the need for cross-platform tracking. To address these challenges, Google introduced Universal Analytics in 2012, marking the next major phase in the evolution of Google Analytics. Universal Analytics brought significant enhancements, including the ability to track user interactions across different devices and platforms, providing a more comprehensive view of the customer journey.
In 2013, Google introduced Universal Analytics (UA), which quickly became the go-to platform for web tracking. However, on March 16, 2022, Google announced that Universal Analytics would be phased out, with the transition set to begin in July 2023. This marked a significant shift in Google’s approach to web analytics, as indicated in their final announcement on the matter.
The period before Universal Analytics was thus characterized by continuous innovation and improvement, as Google Analytics evolved from a basic website traffic analysis tool into a sophisticated platform capable of providing deep insights into user behavior and digital marketing effectiveness.
What happened before GA4?
Google Analytics has changed a lot since Google bought it in 2005. Back then, Google bought a product named “Urchin Analytics” – that’s where the term UTM, or Urchin Tracking Modules, comes from.
This became from now and then the original Google Analytics.
In 2013, Google introduced Universal Analytics (UA), which became the main way to track website data.
New Universal Analytics
Universal Analytics (UA), introduced by Google as the next evolution of Google Analytics, brought several significant improvements and new features compared to the older versions of Google Analytics. Here are some of the key advancements:
- User ID tracking – UA introduced the User ID feature, allowing more accurate tracking of individual users across multiple devices. This was a major leap from the older versions, which were more focused on sessions and didn’t track individual users as effectively across various devices.
- Custom dimensions and metrics – Universal Analytics allowed for more customization in tracking. Users could define their custom dimensions and metrics to track data that was specific to their business needs, something that wasn’t as flexible in previous versions.
- Enhanced E-commerce reporting – UA brought in a more sophisticated e-commerce reporting feature, enabling deeper insights into customer purchasing behavior, product performance, and more detailed transaction data.
- Simplified and more accurate tracking code – the tracking code in UA (analytics.js) was simpler and more efficient compared to the older ga.js script. This resulted in more accurate data collection and easier implementation.
- Offline data tracking – Universal Analytics provided the ability to track offline interactions, a feature not available in the previous versions. This allowed for a more comprehensive view of customer interactions beyond just their online activities.
- Session and campaign timeout handling – UA offered more control over session and campaign timeouts, allowing users to define the length of these periods based on their specific business requirements.
- More powerful data collection API – the measurement protocol in UA allowed for data collection from any digital device, not just websites, broadening the scope of analytics to include things like gaming consoles and customer relationship management systems.
- Enhanced site speed and performance metrics – UA included more detailed site speed and performance metrics, giving insights into how website performance impacted user experience.
- Custom channel groupings and content groupings – it allowed for more granular segmentation of traffic and content, helping in better analysis and understanding of user engagement.
- Mobile app analytics – UA was better equipped for mobile app analytics compared to its predecessors, providing detailed insights into mobile app usage and user engagement.
These improvements made Universal Analytics a more robust, flexible, and user-centric analytics tool, offering businesses deeper insights into their user’s behaviors and preferences.
But on March 16, 2022, Google said UA would stop working in July 2023.
When was Universal Analytics deprecated?
“On July 1, 2023, this property will stop processing data. Starting in March 2023, for continued website measurement, migrate your original property settings to a Google Analytics 4 (GA4) property, or they’ll be copied for you to an existing GA4 property, reusing existing site tags.”
That was the original message all marketers saw for the first time on March 16, 2022, by Google, who announced that Universal Analytics would stop processing hits on July 1, 2023, for standard UA properties, and on October 1, 2023, for UA 360 properties. The announcement, given the relatively short time frame, caught many marketers off guard and sparked a bit of panic within the (marketing and web analytics) industry. Although Google Analytics 4 had been available since October 2020, its adoption rate was still quite low at the time. This likely influenced Google’s decision to expedite the transition by setting an earlier deprecation date for Universal Analytics.
While more than a year might have seemed like sufficient time to implement a new tracking script on a website, the critical role of Google Analytics for most businesses in performance measurement made the transition period quite significant. Prior to starting the implementation of Google Analytics 4, it was essential to grasp its differences from Universal Analytics. Our list of important distinctions was prepared to aid in this understanding.
What were the main reasons Google introduced GA4?
Google introduced Google Analytics 4 (GA4) primarily to adapt to the evolving digital landscape where technology and user behavior are constantly changing. The traditional version of Google Analytics (Universal Analytics) was not equipped to provide accurate insights considering these rapid changes. Here are the main reasons for the introduction of GA4:
- Adapting to a changing digital landscape – GA4 was designed to keep up with advancements in technology and the evolving patterns of user behavior, which the older version may not accurately capture. In an increasingly dynamic digital environment, Google Analytics 4 (GA4) has been engineered to provide a robust analytics tool that keeps pace with the rapid technological advancements and shifting user behaviors online. The predecessor, Universal Analytics, was based on a session-based data model primarily focused on desktop web data. As the internet landscape transitioned more towards mobile and app-based interactions, Universal Analytics’ capabilities to provide insightful data started lagging.GA4 introduces an event-based data model that is more adaptable and suitable for a variety of user interactions across websites and apps. This model allows for the collection and analysis of data from both web and app sources in a unified manner, offering a more comprehensive view of user engagement. This is crucial as user interactions become more varied and less predictable, with multiple devices and platforms being used interchangeably. Moreover, GA4’s flexible approach to data measurement recognizes that the digital landscape is not static. It acknowledges the introduction of new platforms, devices, and user behaviors that could emerge in the future, ensuring that the tool remains relevant and effective.
- Privacy-first approach – GA4 represents a shift towards privacy-centric tracking. With increasing concerns about user privacy and data protection, GA4 aims to address these challenges while still offering robust analytics. The decade-old Universal Analytics (UA) platform, with its data architecture that increasingly hindered scalability and its non-compliance with emerging data privacy laws like GDPR and CCPA, created an urgent need for Google to facilitate a transition to a more modern solution. This led to the development of Google Analytics 4 (GA4), which has been fundamentally designed with privacy at its core to meet these contemporary challenges.GA4 ushers in a range of privacy-centric features to help businesses align with stringent data protection standards. These features include:
- IP anonymization – by default, Google Analytics 4 anonymizes IP addresses, reducing the risk of personal data breaches and ensuring user anonymity.
- Data retention controls – Google Analytics 4 offers more granular controls over data storage durations, allowing organizations to decide how long they retain data.
- Server and data transfer locations – Google Analytics 4 provides clear policies regarding the location of its data servers and restricts data transfers, crucial for compliance with regulations like GDPR which have specific requirements about where and how personal data can be stored and processed.
- Consent mode – this feature allows businesses to adjust how they collect and use data based on the consent provided by users, ensuring compliance with user privacy preferences.
- User data deletion – Google Analytics 4 enables the deletion of users’ personal data upon request, supporting the ‘right to be forgotten’ as stipulated by privacy regulations.
- PII handling rules – strict rules on the handling of personally identifiable information (PII) are implemented to prevent privacy violations.
- Cross-channel measurement – the platform is geared towards x-channel measurement, which allows for a more integrated view of the customer journey across different platforms and devices.
- Advanced machine learning – GA4 incorporates Google’s advanced machine learning to provide predictive insights and data, which can help organizations anticipate future actions of users and better understand the patterns in website traffic and user behavior without relying on traditional page hits.
- Enhanced data visualization and analytics – with a focus on machine learning and data visualization, GA4 offers more comprehensive predictive analytics and insights, as well as improved data visualizations compared to its predecessor. It also simplifies the tracking process, making it more user-friendly.
All key differences between GA4 and Universal Analytics
How does GA4 measure users compared to Universal Analytics?
Universal Analytics relies on “cookie-based” tracking to collect data. When a website uses Universal Analytics, it places a cookie in the user’s web browser. This cookie enables the platform to monitor and record the user’s web activity during their session on the site. Universal Analytics uses a session-based data model for measurement.
In contrast, GA4 offers a more versatile approach. According to Google, GA4 allows businesses to measure user activity across various platforms and devices using multiple forms of identity. This includes first-party data and “Google signals” from users who have consented to personalized ads. GA4 also continues to use cookies where available for tracking purposes. However, instead of relying solely on tracking sessions, GA4 adopts an event-based data model.
In today’s privacy-conscious world, the use of cookies is under scrutiny, and their prevalence may decrease over time. While this trend is arguably positive for user privacy, it poses challenges for digital marketers, who have traditionally relied on cookies for tracking and targeting.
| Universal Analytics properties | Google Analytics 4 properties | |
| Measurement | Session-based data model | Flexible event-based data model |
| Reporting | Limited cross-device and cross-platform reporting | Full cross-device and cross-platform reporting |
| Automation | Limited automation | Machine learning throughout to improve and simplify insight discovery |
In GA4, users are tracked using an event-based data model, differing from the session-based model used previously. Unlike Universal Analytics, which mainly uses the ‘Total Users’ metric, GA4 emphasizes ‘Active Users.’ It also tracks ‘Total Users,’ ‘New Users,’ and ‘Returning Users.’ While diving into this aspect of GA4 might not be advisable for beginners in Google Analytics, a guide on user measurement in GA4 could serve as a valuable resource for future reference.
In GA4, all hits are tracked as an event
Let’s get this straight from Google. The Session-Based Model.
In UA properties, Analytics groups data into sessions, and these sessions are the foundation of all reporting. A session is a group of user interactions with your website that take place within a given time frame.
During a session, Analytics collects and stores user interactions, such as pageviews, events, and eCommerce transactions, as hits. A single session can contain multiple hits, depending on how a user interacts with your website.
How about the event-based model?
In GA4 properties, you can still see session data, but Analytics collects and stores user interactions with your website or app as events. Events provide insight on what’s happening in your website or app, such as pageviews, button clicks, user actions, or system events.
Events can collect and send pieces of information that more fully specify the action the user took or add further context to the event or user. This information could include things like the value of purchase, the title of the page a user visited, or the geographic location of the user.
This might not sound like much, but this is a huge, huge difference.
Event-based data vs. session-based data
Displayed in the table is how Google Analytics captures data. On the left, the Universal Analytics property lists various “hit types,” each representing a different kind of data. In web analytics, a “hit” refers to any interaction a visitor makes with your site or app, such as a click, page view, scroll, file download, purchase, or any other trackable action. On the right, the GA4 property simplifies this by categorizing all types of hits as Events.
| Universal Analytics | Google Analytics 4 |
| Page View | Event |
| Event | Event |
| Social | Event |
| Transaction/e-commerce | Event |
| User timing | Event |
| Exception | Event |
| App/screen view | Event |
Events existed in UA as well; with an associated category, action, and label; but these classifications do not exist in GA4. Instead, GA4 works with event parameters that are additional pieces of information about the action (event) a user took. Some event parameters are sent automatically, such as page_title, and additional ones can be added (you can log up to 25 event parameters with each event). Since the data models are fundamentally different, Google recommends that you do not simply copy over existing event logic from UA to GA4, but instead implement new logic that makes sense in this new context.
Universal Analytics can track events such as button clicks, scroll depth, and downloads, but this necessitates the use of Google Tag Manager. In GA4, while some events still require Google Tag Manager for tracking (known as “recommended events” and “custom events”), there are also events that GA4 automatically measures without additional tools. These automatically tracked events are divided into two categories: “automatically collected events” and “enhanced measurement events.”
Event types in GA4
Let’s dive deeper into the different event categories in GA4, as outlined in the Google Developers guide for GA4.
There are four main event categories in GA4, but I’ll focus on two: Automatically Collected events and Enhanced Measurement events. These event types are logged automatically through either gtag or gtm configuration and don’t require extra coding.
Here’s an overview of automatically collected events:
- session_start: Triggers when a user initiates a session on a website or app.
- first_visit: Fires if it’s a user’s first visit to the site or app.
- user_engagement: This occurs when a visitor has been on a page for at least 10 seconds, viewed two pages, or completed a conversion event. GA4 tracks this automatically.
Now, regarding enhanced measurement events:
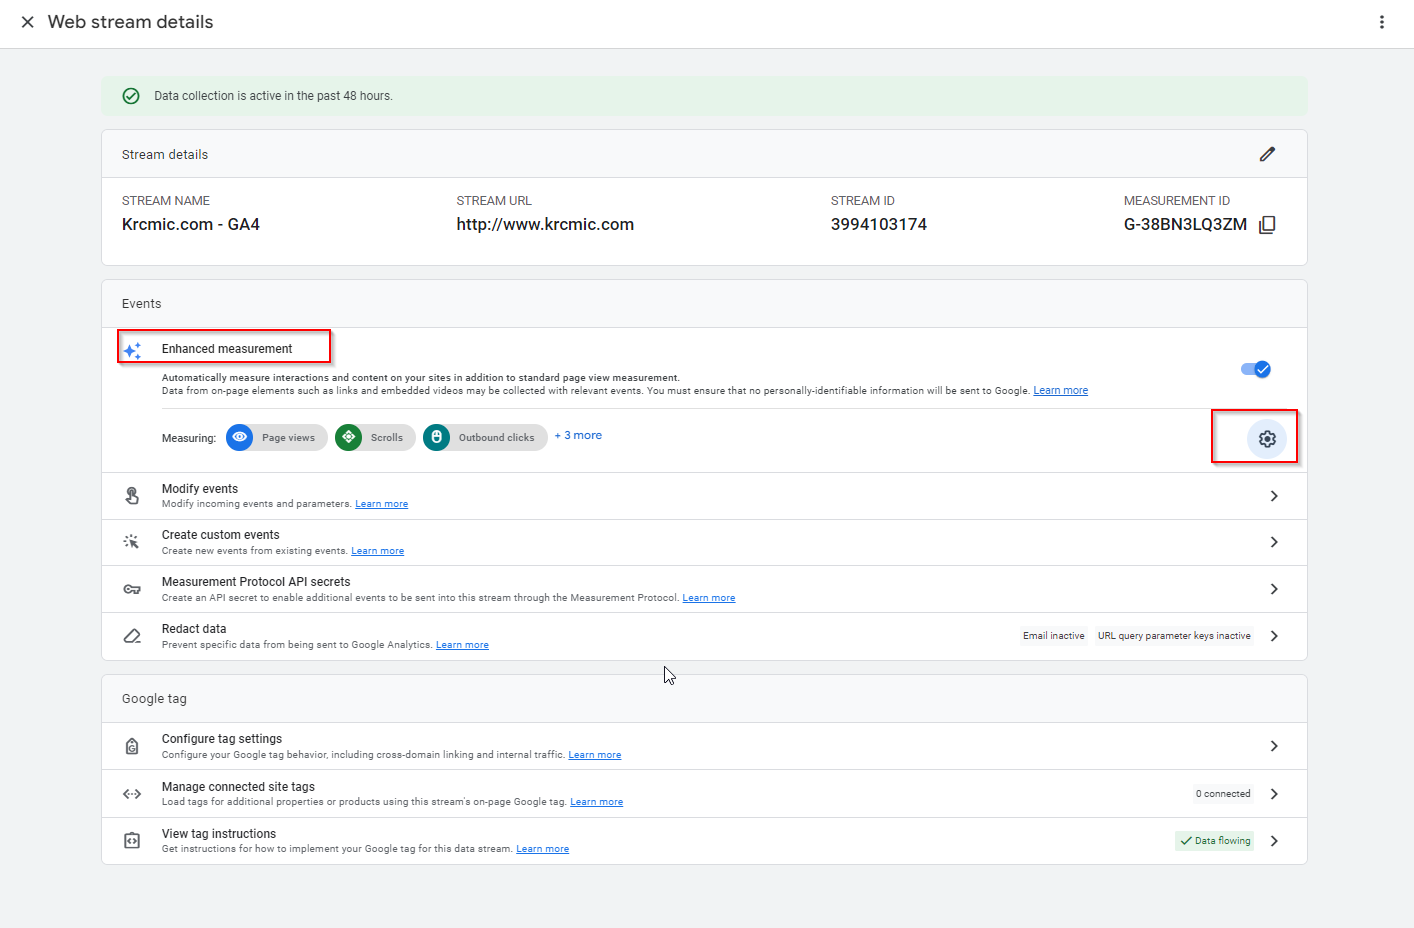
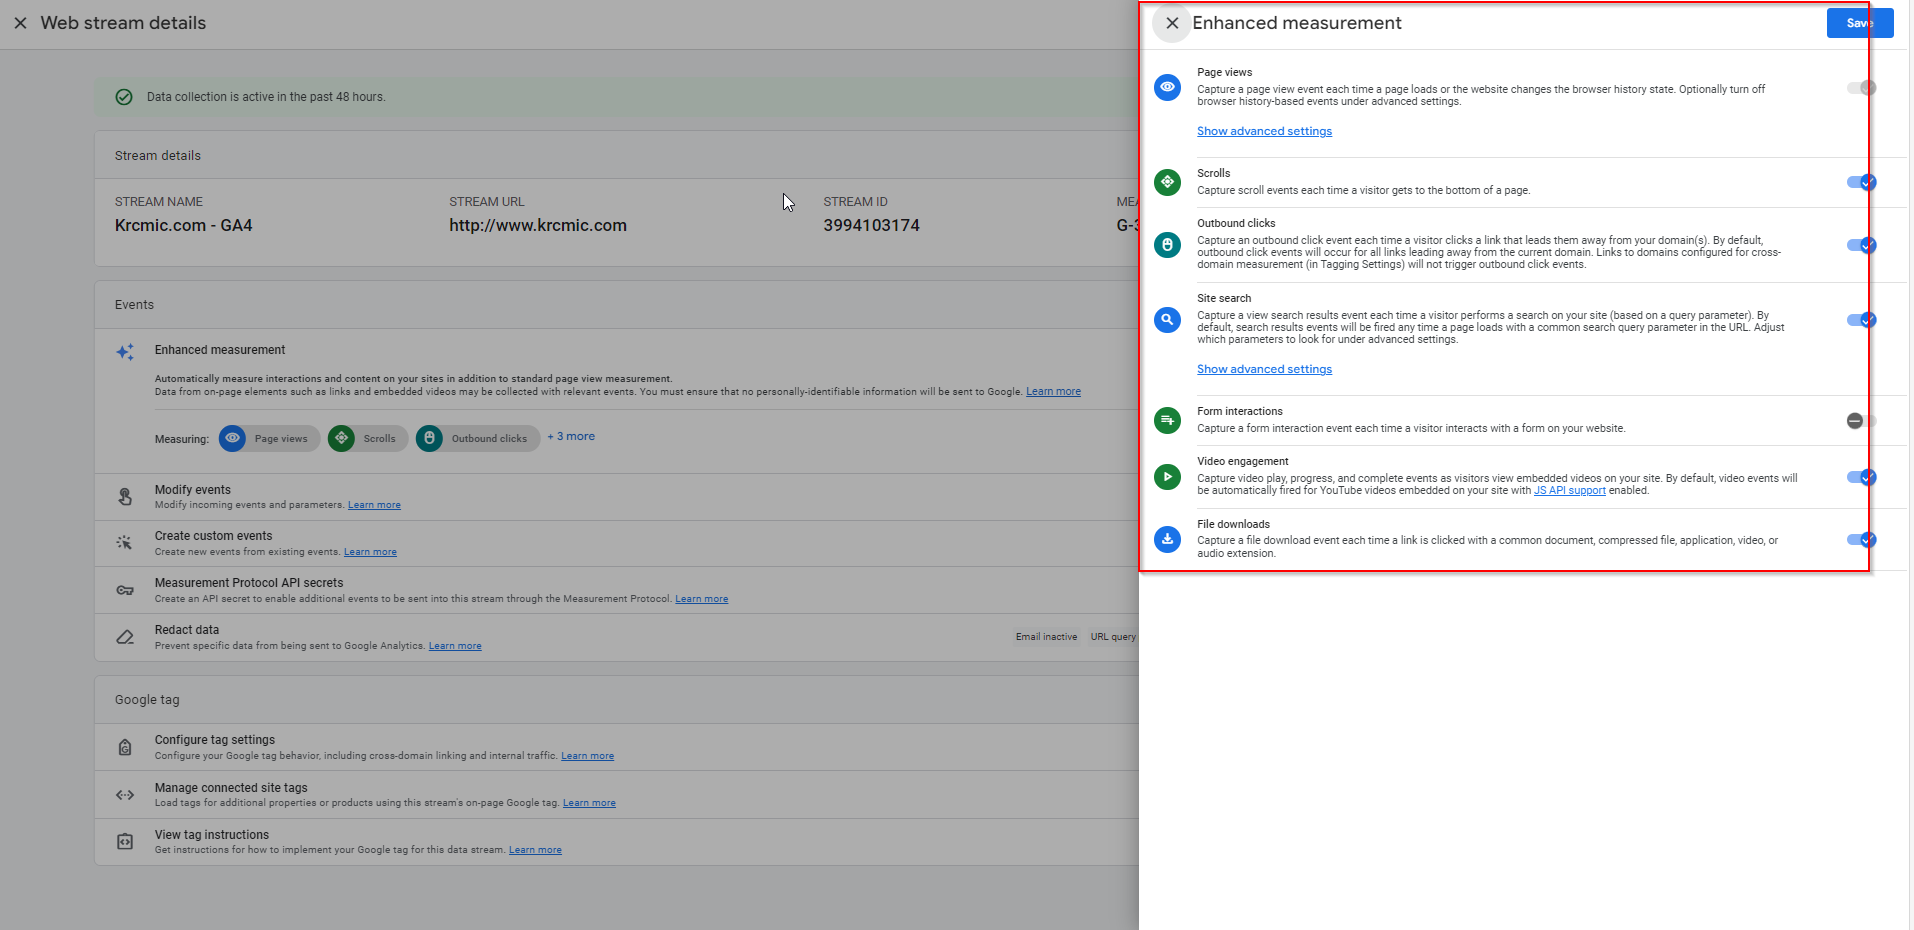
These include page views, scrolls, outbound clicks, site searches, video engagement, and file downloads. Enhanced measurement events are particularly noteworthy as an upgrade in GA4 compared to UA, where tracking these events requires additional effort.
In the Admin section of your GA4 property, under Data Stream, you can view these enhanced measurement events. Except for page views, you have the option to toggle off any of these enhanced measurement events if you choose.
- Category 3 – Recommended Events – these events come with predefined names and parameters, tailored for various business models. Implementing them requires custom coding, often done via Google Tag Manager. Their defining feature is that Google has suggested specific names for these events. For instance, when a visitor adds an item to their cart, Google suggests naming this event add_to_cart. The initiation of the checkout process should be labeled as begin_checkout, and the submission of a contact form as generate_lead. You can find a comprehensive list of these Recommended Events on Google’s website, detailing all the suggested event names.
- Category 4 – Custom Events – similar to recommended events, custom events also need custom coding and can be set up using Google Tag Manager. However, unlike recommended events, there are no predefined names or parameters from Google. For example, tracking internal link clicks on your site would fall under custom events. While GA4’s Enhanced Measurement can track outbound (external) link clicks, tracking internal link clicks requires more effort through custom event implementation. The following sections offer a comparison of how to approach this.
Tracking link click events in GA4 vs. UA
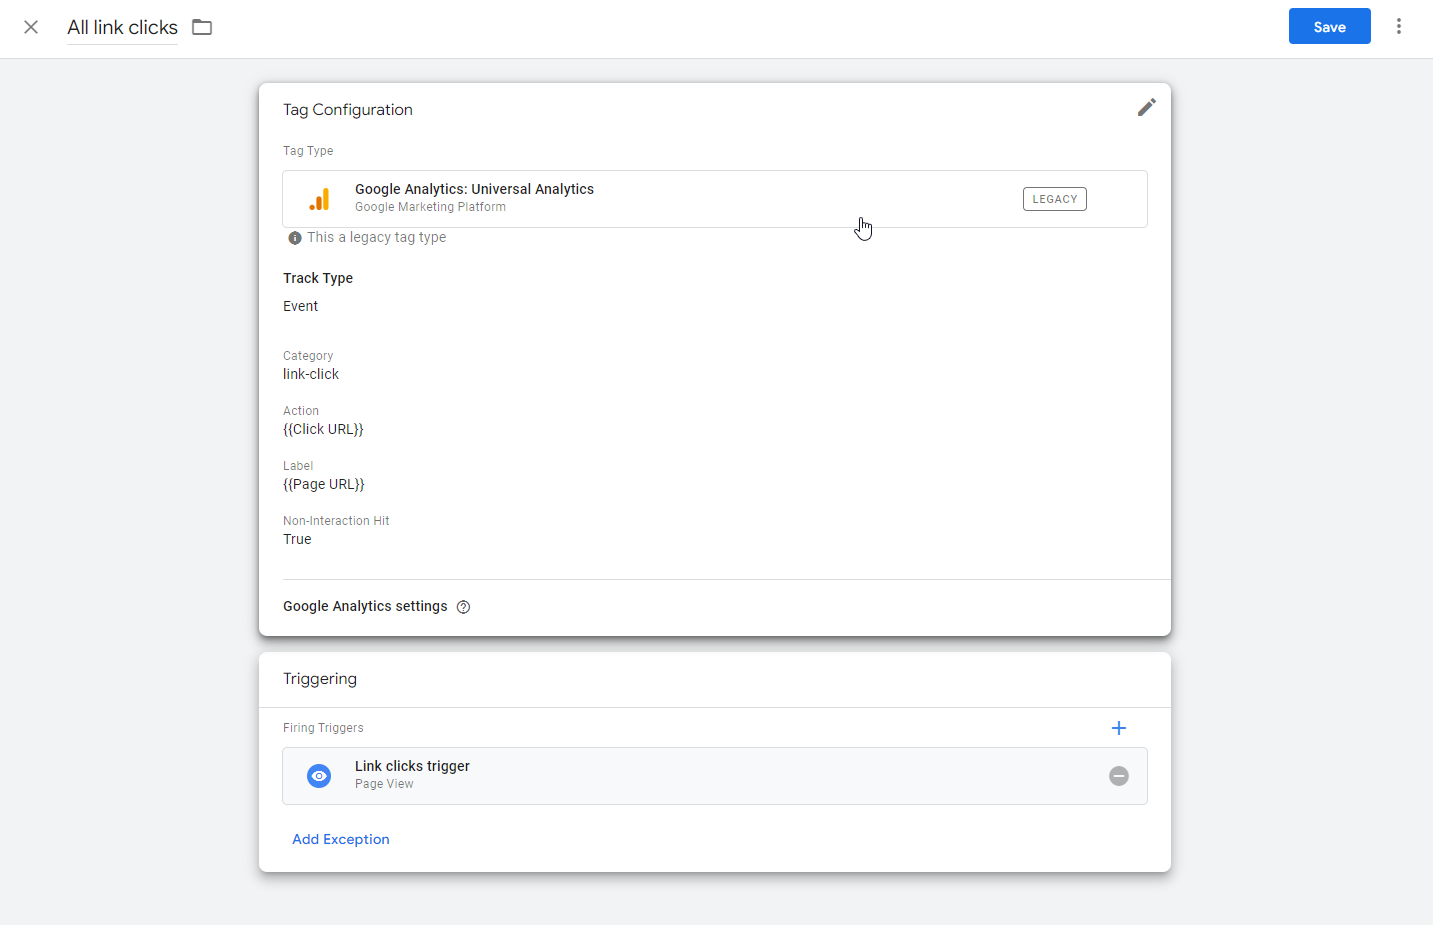
In Universal Analytics (UA), data tracking primarily revolves around pageviews. UA tracks when a URL loads, capturing that as a pageview. However, user actions that don’t lead to a new page loading on the tracked domain, such as video plays or clicks within or outside the domain, aren’t automatically tracked. For tracking these “events” like link clicks, Universal Analytics requires assistance from Google Tag Manager.
Setting this up can be quite intricate, especially for marketers doing it for the first time. It involves creating variables, triggers, and tags in Google Tag Manager to track specific actions, translating them into data in Google Analytics. For example, a Universal Analytics event tag might be configured to track all link clicks on a particular site. A key difference in UA, compared to GA4, is the use of pre-defined “event parameters” such as category, action, and label. These parameters provide additional context to the tracked event, aiding in data interpretation.
- Category = link_click: This parameter is consistently used every time the tag is activated.
- Action = {{Click URL}}: This variable captures the specific URL clicked by the user.
- Label = {{Page URL}}: Another variable, this one records the URL of the page the user was on when the link was clicked.
In contrast, GA4 simplifies this process by automatically tracking certain types of link clicks, reducing the need for such a detailed setup in many cases.
Event tracking in GA4
Contrary to Universal Analytics, GA4 is designed with event tracking capabilities built-in, rather than relying primarily on pageview tracking. As previously mentioned, GA4 automatically tracks certain types of events (like automatically collected events and enhanced measurement events). However, for recommended events and custom events, manual creation using Google Tag Manager is necessary.
GA4 automatically captures some basic “event parameters” with every event. These include:
- language
- page_location
- page_referrer
- page_title
- screen_resolution
For additional parameters in recommended and custom events, there’s an extra step involved: these parameters need to be registered as custom dimensions in GA4. This aspect of GA4 can be initially confusing and for those finding it non-intuitive, consulting a practical guide on understanding event parameters in GA4 might be beneficial.
While some events in GA4 can be tracked directly (like automatically collected events and enhanced measurement events), others, such as recommended events and custom events, still require the use of Google Tag Manager. An illustrative example of this is tracking internal link clicks, which falls under the category of events requiring additional setup in GA4.
How to compare reporting in Google Analytics 4 (GA4) and Universal Analytics (UA)
Universal Analytics was designed as a robust platform with a variety of standard reports, whereas GA4 offers relatively fewer standard reports, placing a greater emphasis on custom reporting or data exportation. Examining the area of acquisition reporting, which is crucial in Google Analytics, highlights the differences between GA4 and UA.
Acquisition reporting is essential for analyzing the performance of different traffic sources on a website. This type of reporting is critical for evaluating the effectiveness of channels like organic search, email, and social media in driving purchases or other conversions. It not only aids in understanding overall business performance but also assists in making informed decisions about budget allocation.
While the fundamental concept of acquisition reporting in GA4 is similar to that in UA, there are notable distinctions. GA4’s approach to acquisition reporting might require more customization or data manipulation compared to the more out-of-the-box solutions provided by UA. This shift indicates a move towards a more flexible, albeit potentially more complex, reporting framework in GA4.
GA4 reports
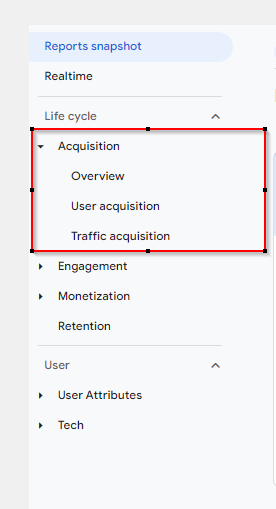
In GA4’s Acquisition reporting section, as highlighted in the above box, there are just three standard reports available. A significant omission here is the Source/Medium report, which was highly favored for its effectiveness in analyzing traffic performance across various channels (like comparing google / organic with bing / organic or google / cpc).
The whole interface has changed and some standard reports need to be activated via Library in the left-down corner (you have to also publish the changes, otherwise you will see no change in default reports).
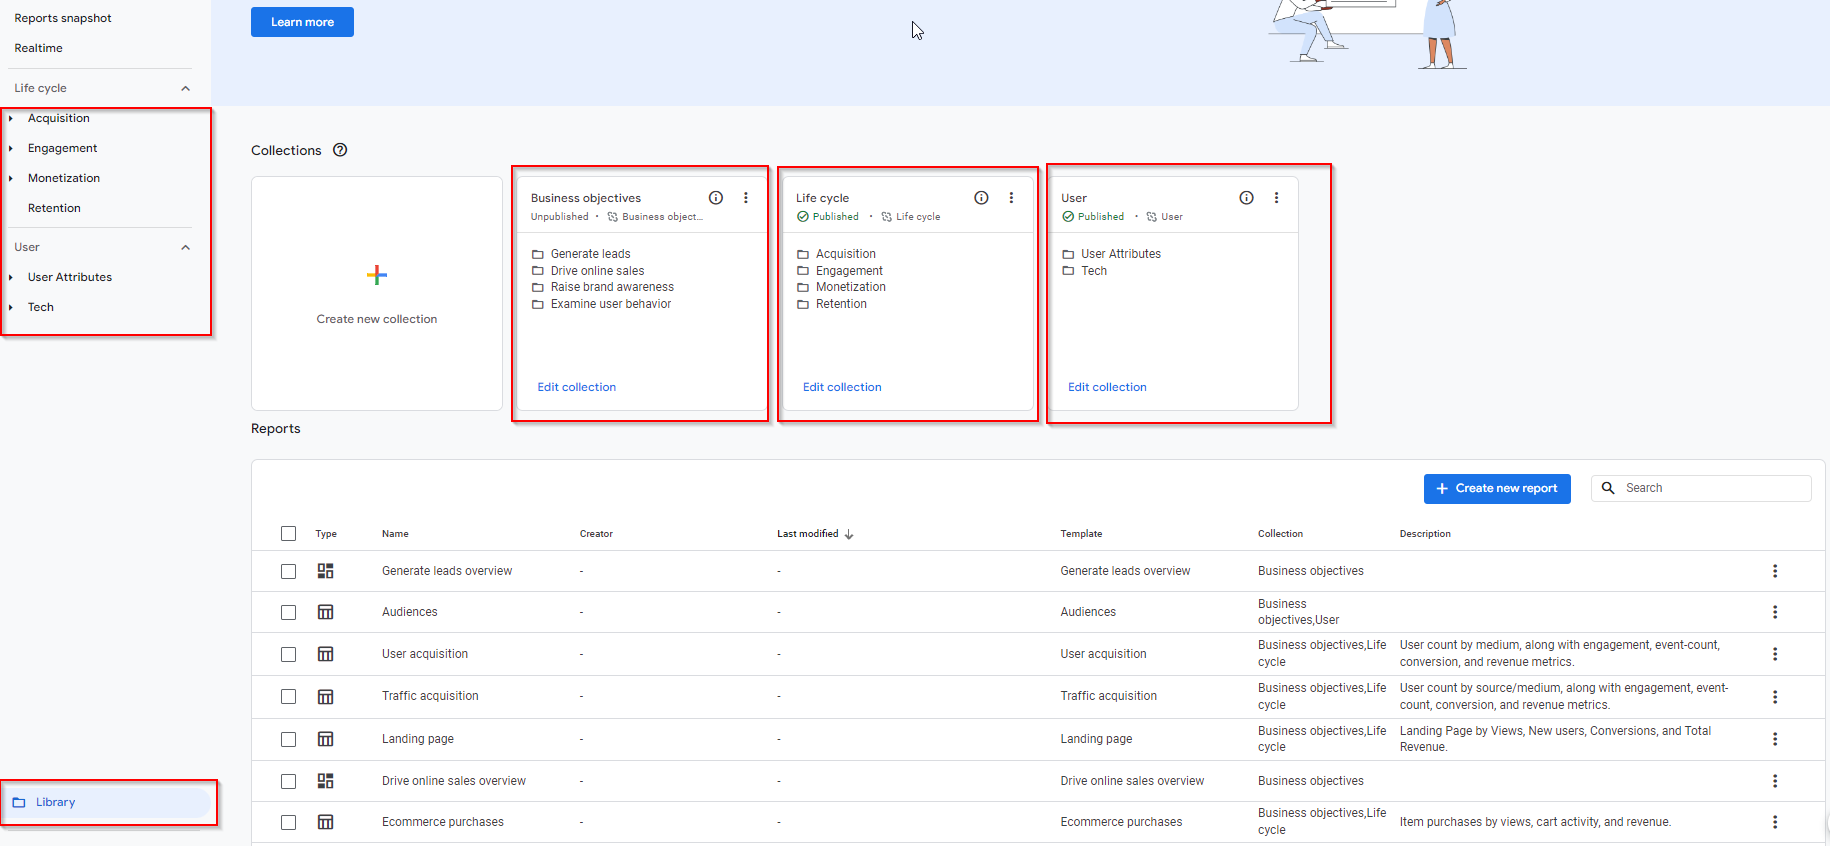
You can adjust all reports according to your needs (you can create your own views).
To conduct more nuanced analyses in GA4, additional effort is required.
This could involve exporting data for deeper examination or creating custom “Exploration” reports.
Another option is to integrate with Looker Studio (previously known as Data Studio) to construct more tailored reports. While these custom reports can be extremely useful, they initially demand more time and effort to set up compared to the more straightforward reporting system in Universal Analytics. F
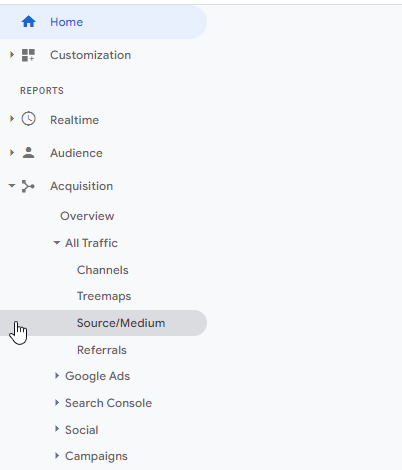
Universal Analytics reports
In Universal Analytics (UA), as indicated in the blue box, a significantly larger array of standard reports is available compared to GA4. When you dive into all the reporting sections in UA, you’ll find a total of 30 standard reports. This is a stark contrast to the mere 3 standard reports offered in GA4.
And, of course, we see the faithful Source / Medium report among the 30.
User reports (UA) in GA4 – cheatsheet
| Universal Analytics | Google Analytics 4 |
| Demographics data – overview | User – User Atributes – Overview |
| Age / Gender / Location | User – User Atributes – Demographic details |
| Technical data – overview | Tech – Tech Overview |
| Operation system / Device type / Browsers | Tech – Tech Details |
Acquisition reports (UA) in GA4 – cheatsheet
| Universal Analytics | Google Analytics 4 |
| Acquisition Overview | Lifecycle – Acquisition – Acquisition Overview |
| All Traffic – Channels | Lifecycle – Acquisition – Traffic acquisition: Session default channel group
Advertising – Performance – All Channels |
| All Traffic – Source/Medium | Lifecycle – Acquisition – Traffic acquisition: Session default channel group |
| All Channel Reports – by users | Lifecycle – Acquisition – Users |
| Google Ads | Lifecycle – Acquisition – Acquisition Overview – Google Ads tab |
| Search Console | Search Console – Search Console – Queries |
| Google Organic Search | Search Console – Search Console – Google organic search traffic: Landing page + query string |
| Organic Traffic (all) | Lifecycle – Acquisition – Traffic acquisition: Session default channel group |
Behaviour + event reports (UA) in GA4 – cheatsheet
| Universal Analytics | Google Analytics 4 |
| All Pages | Lifecycle – Engagement – Page and Screens |
| Events | Lifecycle – Engagement – Events |
| Behaviour (new vs returning users) | Lifecycle – Retention (you can find here also Customer Lifetime Value metric) |
E-commerce reports (UA) in GA4 – cheatsheet
| Universal Analytics | Google Analytics 4 |
| Conversions | Lifecycle – Engagement – Conversions |
| Items Revenue | Business Objectives – Drive Online Sales – E-commerce Purchases |
| Purchase Funnel | Business Objectives – Drive Online Sales – Purchase Journey |
Metrics comparison: GA4 vs. Universal Analytics
In GA4, there are three new metrics that differ from those in Universal Analytics (UA):
- Engaged session – Google defines this metric as a session that lasts longer than 10 seconds, includes a conversion event, or has two or more screen or page views.
- Average engagement time per session – this metric measures the duration of user engagement per session, essentially the time spent actively interacting with the page (like scrolling) while it remains the primary window on the screen.
- Engagement rate – this is calculated as the ratio of Engaged Sessions to total sessions. For example, if you have 1,000 total sessions and 130 qualify as Engaged Sessions (as per Google’s definition), the Engagement Rate would be 13%.
These metrics are not available in UA.
They replace some of the metrics that were phased out in GA4, such as average session duration, pages per session, and bounce rate (the percentage of single-page view sessions).
Regarding bounce rate, although initially absent in GA4, it was later introduced but with a different calculation method than in UA, which can be confusing. Understanding this difference is crucial for the accurate interpretation of data in GA4.
The reason behind these metric differences between GA4 and Universal Analytics relates to their respective data models. UA’s model is centered around sessions and pageviews, making it straightforward to calculate metrics like pages per session or bounce rate. In contrast, GA4’s model prioritizes event collection and processing over traditional page views and sessions, necessitating a different approach to metric calculations.
Difference between sessions in GA4 and UA
Definition of session in Universal Analytics (UA)
Sessions end when:
- 30 minutes of inactivity (or your session timeout settings)
- The clock passing midnight (resulting in a new session)
- New campaign parameters are encountered (i.e. if you use UTM parameters for internal links on your website > therefore, this is not recommended by Google to use UTMs for internal linking of your website).
Definition of session in Google Analytics 4 (GA4)
Fewer occurrences of how a session can end. Sessions end only if there is:
- 30 minutes of inactivity (or your session timeout settings)
- the session can now carry over across midnight
- session and are not affected by encountering new campaign parameters
If your site has a global audience, this can cause discrepancies in the session figures you see for UA and GA4 respectively.
Why bounce rate is no longer used in Google Analytics 4?
There are plenty of reasons why Google decided to phase out the old bounce rate when it first launched GA4, from a perceived lack of relevancy to the popularity of single-page applications (SPA). Bounce rate has been around since the beginning of Google Analytics, which means it took more than a decade for marketers and agencies to become attached to the bounce rate. But in an age of single-page applications, the old definition of bounce rate isn’t useful anymore. Since there’s technically only one “page,” every visit is seen as a bounce, which isn’t true or helpful.
Single-Page Applications (SPAs):
- Unlike old websites where every click loads a new page, SPAs rewrite the current page on-the-fly, making things fast and smooth.
- Big names like Gmail, Netflix, and Facebook use this design, making your browsing quick and seamless without waiting for new pages to load.
Google now focuses on more meaningful interactions, looking at what users do on the page, rather than just counting page loads. This way, businesses can understand their audience better and see if their website is actually engaging or needs improvement.
Therefore Google has chosen to take a more “positive” approach and report on figures for bounce rate => new metric engagement rate = bounce rate is the inverse of engagement rate.
But also it is calculated differently in GA4 than in UA.
GA UA vs GA4 – how are bounce rate and engagement rate calculated
- Bounce rate in Universal Analytics – someone visits your client’s website and only looks at a single page before leaving, that is considered a “bounce” in UA.
- Bounce rate in GA4 – the bounce rate in Google Analytics (GA4) is the percentage of sessions that:
- were less than 10 seconds long,
- had zero conversion events or
- had less than 2 page or screen views.
- Engagement rate in GA4 – an inverse metric of bounce rate.
GA UA vs GA4 – longer data processing delay
- As you migrate to GA4, one of the first things you may notice is the extended data processing time, which leads to delays.
- Universal Analytics typically provides data within four hours.
GA4 introduces a wider range of data delays, spanning from 12 to 48 hours.
GA UA vs GA4 – Google Tag Manager is even more important
Now, with GA4, this is no longer possible. All goals are event-based, so you need Google Tag Manager to set it.
A lot of standard settings which UA had in default, now need manual setup in GTM/GA4.

Segments in Google Analytics 4 (GA4) vs. Universal Analytics (UA)
Segments in both GA4 and Universal Analytics serve the same fundamental purpose: they enable the analysis of specific subsets of your Google Analytics data, providing deeper insights into user behavior and website or app performance. While segments operate similarly in both versions, allowing analysis of up to four segments simultaneously, there are differences in the types of segments you can create and the process of creating them.
In GA4, there are three types of segments available for creation:
- User segments – focus on the characteristics and behavior of individual users.
- Session segments – focus on specific sessions.
- Event segments – targeting particular events.
In contrast, Universal Analytics offers only two types of segments:
- User segments.
- Session segments.
The most notable difference lies in the process of creating these segments. In GA4, segment creation is integrated into the “Explorations” section, the same area used for creating custom reports. This integration signifies a more unified approach to data analysis and reporting in GA4. For a detailed comparison and guidance on creating custom segments, reviewing a walkthrough of segment creation in Google Analytics 4 versus Universal Analytics could be highly beneficial.
Website and app tracking in the same property
A highly anticipated feature of GA4 is its capability to consolidate the tracking of both website and app data within a single property. GA4 adopts the measurement approach utilized by Google Analytics Firebase, which is tailored for mobile apps, where every user interaction is recorded as an event. This event-based model allows for a seamless integration of data across websites and mobile apps. The unified data framework simplifies the process of aggregating and analyzing user behavior across different platforms, providing a holistic view of the user journey. This means analysts and marketers can track a user’s interaction from the website to the app, or vice versa, without losing context, making it considerably easier to assess combined data for comprehensive insights.
Additional Advantages of Google Analytics 4 (GA4)
Google highlights several key benefits of GA4, emphasizing its advanced capabilities in understanding user interactions and adapting to the evolving digital landscape:
- Enhanced user interaction tracking – GA4 is designed to measure, unify, and de-duplicate user interaction data, offering a clearer picture of the user journey across platforms and devices.
- Adaptability to privacy changes – the platform is built to adjust to changing privacy regulations and user expectations, ensuring data collection remains compliant and effective.
- Intelligent business insights – GA4 utilizes machine learning to uncover valuable business insights, helping users to understand and predict customer behaviors more accurately.
- Actionable data utilization – the system is geared towards helping businesses more effectively act on their data to achieve specific goals and objectives.
- Free integration with Google BigQuery – GA4 offers free integration with Google BigQuery, a feature previously available only in the paid GA360 plans with Universal Analytics. This integration is a significant enhancement, allowing for more complex data analysis and processing.
From a practical learning perspective, the most important advantage is that Google has positioned GA4 as the new standard for digital analytics. This means that, inevitably, GA4 will replace Universal Analytics for all digital marketers and measurement teams, making proficiency in GA4 not just beneficial but essential for future success in the field.
Was this article helpful?
Support us to keep up the good work and to provide you even better content. Your donations will be used to help students get access to quality content for free and pay our contributors’ salaries, who work hard to create this website content! Thank you for all your support!
Reaction to comment: Cancel reply