
Microsoft Power BI — A Complete Beginner’s Guide
Analyzing, visualizing, and sharing data is highly important in businesses. However, there are certain business owners who aren’t tech-savvy and don’t have any idea of how any of this works. In this regard, Microsoft Power BI can be of great help.
Microsoft Power BI is referred to as a business intelligence platform that provides the essential tools for interpreting, sharing, and visualizing data. If you know and understand the basic working of Excel, you will find the user interface of Microsoft BI quite intuitive. Also, it is quite integrated with some other Microsoft products. With just a little bit of training, you can grasp all the concepts of Microsoft power BI.
Small to medium businesses can enjoy the services of the free version of the Power BI, whereas the professional version, Power BI Plus, is devised to help large business owners. This version comes with a monthly subscription fee. To use Microsoft Power BI, you’ll need to download its application for Windows 10, known as Power BI desktop. To use it on iOS and Android, you’ll need to download native mobile apps. There are certain companies that are liable to not only report their data but maintain it as well. To do this efficiently, Microsoft developed a unique version of the desktop application known as Power BI for Power BI Report Server.
Common uses of Power BI
Microsoft Power BI has a lot of significant uses. It digs deeper into the data insights within an organization. It helps in integrating the incongruent data followed by its cleaning and transforming into more conformed data to create graphs and models. In this way, you can visualize the data in a better way. You can also share this data with other organizations that use Power BI.
Power BI creates various data models that tell stories regarding the working of the organization through data visualizations, graphs, and charts. It also critically analyzes all the “what if” questions roaming around the data. The reports of Microsoft Power BI also aids in answering the questions in real-time. By examining the collected data, Power BI also predicts whether an organization will be able to meet business metrics or not.
With the help of Power BI, the managers and administrators can also look over all the data through an executive dashboard and, thus, manage it more efficiently. They will also get an idea of how the different departments of the organization are working.
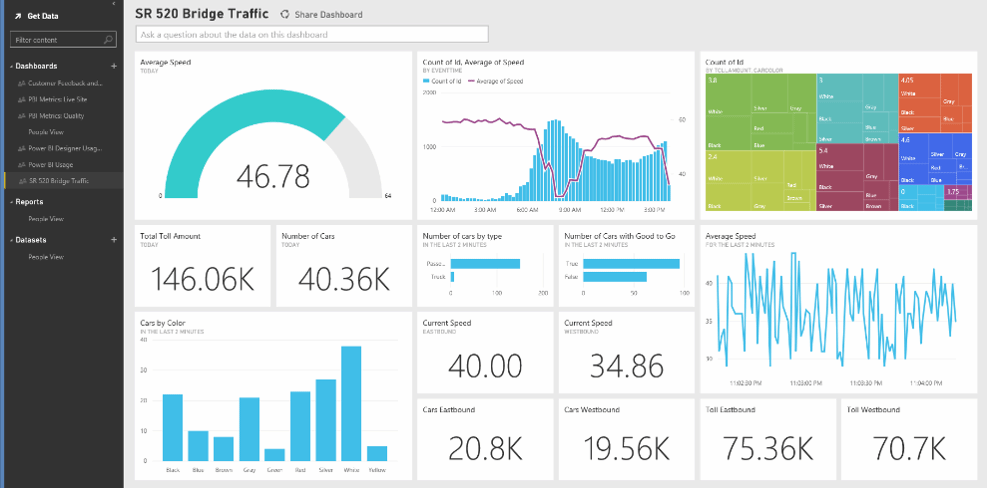
The mentioned above picture shows the executive dashboard of a certain organization. It illustrates the capabilities of the Power BI and how it benefits the organization.
Who uses Power BI
Generally, Power BI refers to being a self-service tool that provides data analytics and data insights to the people working in an organization. However, if we dig a little deeper into the question of who uses Microsoft Power BI, we find that the business intelligence experts and data analysts make the most out of this platform. These professionals come up with various models of the data and then, distribute the information gathered throughout the organization. But, if you don’t have an analytical or technical background, you can still use Power BI and develop viable reports.
As already mentioned, all the representatives of the organization’s departments use Power BI to find insights within the data and to provide reports. On the other hand, the management uses Power BI to forecast whether the organization’s departments will achieve the business goals or metrics or not. This prediction of the business metrics also assists in marketing and sales.
The administrators of an organization also utilize Power BI to monitor the use of it and configure its implementation.
With the definition and uses of Power BI out of the way, let’s take a look at some of the fundamental features of this platform.
Key features of Power BI
Power BI is jam-packed with a large number of analytical features and Microsoft keeps on adding more to make it more efficient. However, in this blog, we are only going to discuss the most significant features of this platform and they are listed as follows:
Artificial intelligence
With the help of Microsoft Power BI, business intelligence professionals can access text analytics and image recognition. By using the automated machine learning capabilities, they can also create machine learning models and incorporate them with Azure machine learning.
Hybrid deployment support
Microsoft Power BI consists of a number of built-in connectors that help this platform in connecting with several other sources of data from Microsoft itself, Salesforce, etc.
Quick Insights
Power BI can integrate the data into various datasets and apply the analytics automatically. In this way, it gathers all the required information regarding the organization’s data.
Common data model support
The organization can collect a wide range of data charts, graphs, and other diagrams (relationships, attributes, and entities) by supporting the common data model.
Cortana integration
This feature mainly tackles the analysts who use this platform on mobile phones. The digital assistant of Microsoft, Cortana, helps in gathering verbal query data utilizing natural language.
Customization
By using Power BI, the developers can change default visualization settings along with the appearance of the reporting tools. This platform also allows the developers to transfer and incorporate new tools into it.
APIs for integration
Power BI consists of application performance interfaces (APIs) and sample code that allows the developers to integrate the dashboard of this platform with other products of the software.
Self-service data prep
Power BI has a feature known as the Power Query. Business analyst experts can make use of this feature and integrate, ingest, enrich, and convert big data into the web service of the Power BI. The developers can share this newly ingested and integrated data across a variety of Power BI dashboards, models, and reports.
Modeling view
To consume and understand the data in a simpler way, Power BI helps in dividing the complex datasets into separate schemas according to their subjects. Also, in the properties panel, you can not only set common properties but also modify them. The developers can even set different display folders depending upon the kind of data.
Microsoft Power BI updates
Power BI was originally launched in July 2011 and was named Project Crescent. The code name of this project was referred to as Denali and it used to work with SQL server. It was in September 2013 when this project was renamed as Power BI and it came up on the surface as Power BI for Office 365. At first, Microsoft Power BI consisted of the features like Power View, Power Query, and Power Pivot. But, with time, Microsoft added a lot more features covering the security and connectivity issues of major enterprises. In 2015, Microsoft launched Power BI as a separate product that could provide all the options necessary for gathering an organization’s info.
Currently, Microsoft adds new and innovative features to Power BI each month. If you want to keep your Power BI up-to-date, you can get the latest edition of this platform from the Windows store or Power BI site.
Power BI connects data from multiple sources and provides a dashboard of business intelligence to the users. It brings the on-premises and cloud-based data warehouses together. The users only need an Excel spreadsheet to connect with this business intelligence software. The data collected from Salesforce CRM and other cloud-based sources will get refreshed and upgraded automatically. However, the users who use Power BI Desktop or Excel spreadsheet, need to refresh the platform manually or set up a schedule that will refresh the data itself. This will ensure that your data analysts use the most current data to gather insights.
Power BI components
Several apps are integrated into Power BI. You can use this platform either on a mobile device or on a desktop as a SaaS product. Power BI service is referred to as the cloud-based offering, mobile Power BI is applicable on mobile devices, and Power BI Desktop runs on a desktop which is also known as the on-premises version.
Microsoft has incorporated a number of components in Power BI because it wants the users to develop and share the data insights that fit the role of the organization.
The main components of Power BI are:
- Power Query: The users can integrate and transform the data with this tool.
- Power Pivot: The users can model a memory table with this tool.
- Power View: This tool helps in creating data visuals.
- Power Map: It provides a 3D geospatial display of the data visuals.
- Power Q&A: It enables the users to have a Q&A session using natural language.
Now, let’s talk about some of the data sources that can be connected with Power BI. The main data sources include:
- Excel
- XML
- SharePoint folder
In the case of databases, we have:
- SQL server
- IBM
- Oracle
- Google BigQuery
- Amazon Redshift, and others.
Power BI also connects with a number of online services that include:
- Google Analytics
- Salesforce Reports
- Dynamics 365
- Adobe Analytics, and others.
How to use Power BI
Power BI desktop is where the data analysts combine all the data collected from different sources and create reports according to the information gathered. Power BI service is where this information and reports are shared with other data analysts and users. Here, the users can review the reports and look over the workings of the organization’s departments.
The main thing in the working of the Power BI is developing reports. Firstly, the users or developers collect the data from different sources and integrate, transform, and ingest it to create specific reports according to the data gathered. These reports are then shared with other users via Power BI Service. This is mainly done to enable mobile device users and cloud users to interact with the reports. The developers can give permissions to the colleagues either to edit or modify the data or make them unable to edit. The developers can also give permission to other users to create a separate dashboard to interact with the reports.
With the basics of the Power BI out of the way, let’s now take a look at how much this platform will cost your business.
Power BI Pricing— How Much Does Power BI Cost?
Whenever business leaders want to polish or enhance their business intelligence practices, their major concern remains about the pricing of the data analytics platform.
Talking about the Power BI pricing, there is a lot of confusion roaming around. Read below to get a clearer understanding of the Power BI costs.
Note: The below-mentioned information is based on the prices of Power BI calculated in March 2022.
Microsoft Power BI offers two licensing options to its users:
- Power BI Pro
- Power BI premium
Power BI pro charges each user monthly whereas the Power BI premium, in addition to charging per user per month, also has another pricing option known as “per capacity”.
Let’s now explore both of these licensing options one by one. `
Power BI Pro Pricing
The license of Power BI Pro costs $9.99 per user, per month. So, if there are 10 users who are enjoying the services of Power BI, the cost of Power BI Pro will become $100 per month.
According to the webpage of Microsoft Power BI pricing, if you go with Power BI Pro, you will get your hands on the following features:
- Access to the services of Power BI on a mobile phone through the Power BI mobile application.
- Easily publish reports and connect with other users.
- The size limit of a data model is 1 GB.
- The datasets can be refreshed 8 times/day.
- Can connect to over 100 sources of data.
- Develop business intelligence dashboards and reports through Power BI Desktop.
- Develop and share Power BI apps with other users in an organization.
- Access to all the visualizations illustrated by AI.
- 10 GB storage capacity.
Other than the above features, Power BI Pro also offers essential administration and supervising features such as data security and consumption and content creation metrics.
Now, let’s see what Power BI Premium has in store for us.
Power BI Premium Pricing — Per User
As we stated earlier, there are two pricing options offered by Power BI Premium – per user and per capacity.
In this part, we’re going to tackle the per user per month option, and per capacity one will be discussed in the next section.
Power BI Premium (per user) charges $20 per month. Currently, there is work in progress to make this licensing option public. This pricing option provides all the features that Power BI Pro offers. However, there are certain additional features. Power BI Premium (per user) enables you to:
- Create paginated reports
- Have a size limit of the data model of 100 GB
- Refresh the datasets 48 times/day
- Have advanced artificial intelligence
- Have XMLA endpoint write/read connectivity
- Have 100 TB storage capacity
Power BI Premium (per user) consists of the same administrative and governance features as that of Power BI Pro but it also has an additional Power BI application life cycle management feature.
Power BI Premium Pricing — Per Capacity
Now comes the second pricing option for Power BI Premium – per capacity.
If you go with this licensing option, you’ll have to pay $4,995/month. However, to get a license for this pricing option, you’ll need a license for Power BI Pro first. This kind of pricing option is generally useful for large organizations that have a large IT or data analytics team or organizations that consist of numerous users who need access to executive dashboards and reports.
The best part of Power BI Premium (per capacity) is that your users will be able to see and consume the content even if you don’t have the license for Power BI Pro. In this way, no matter how many users you have, they can view the reports and dashboards present on the Power BI Premium. However, one thing you need to make sure of is that, in order to publish the content, you still need a Power BI Pro license.
Together with the administrative and governance abilities, Power BI Premium (per capacity) also provides on-premises reporting through Power BI Report Server.
Till now, we have covered the basics of Power BI and how its pricing works. Now, we are going to take a look at the benefits of Power BI and some challenges that you may face while using this business intelligence software.
Power BI Advantages
Undoubtedly, Power BI has provided a wide range of options to people in the past years. Currently, Microsoft is striving hard to provide more efficient tools to its customers. For instance, it has come up with another on-premises tool known as Datazen. But, for now, Microsoft is focusing more on Power BI and trying to keep making it better. It has been successful so far because many users have highlighted the mentioned below Power BI advantages:
Lower upfront costs
As you already know that Power BI has a lot of versions and all of them cost different. However, the basic version is $9.99 which helps the users in utilizing the Power BI services with minimum risk. However, there can be other costs involved when it comes to data extraction and connectivity. But, Microsoft is trying its best to reduce such costs in the upcoming BI programs.
Machine learning
On December 1st, Microsoft added another feature to Power BI known as Quick Insights. With the help of these features, the users can not only divide the data into various segments but also apply analytics automatically. This feature enables you to have different sets of analytical algorithms which will be applied to your data automatically giving you insights in the form of charts, graphs, diagrams, etc.
This feature is currently being used widely in the health sector to overcome data breaches in organizations.
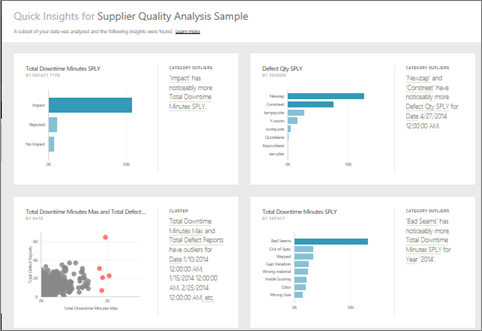
(Picture Credit: Microsoft) This figure shows the Quick Insights data visualization feature of Microsoft Power BI.
Mobility
The tools of Power BI are not only made for iOS but also Android. Thus, Microsoft has made it easier to use these tools on a wide range of devices. The managers of the organizations can download Power BI apps, log in by using their email address and then view the reports and dashboards.
Cortana integration
Microsoft has integrated Power BI with Cortana which is the virtual assistant of Microsoft. You can now understand the analytics of Power BI with verbal questions by using the natural language of Cortana. You can even ask for reports which will be generated in a blink of an eye.
Power BI is integrated with Microsoft’s Cortana virtual assistant. These BI charts were built by asking verbal questions to Cortana.
Customization
Another feature that has benefited the developers most is the customization capabilities for visuals. If you want to change the Power BI’s visuals or you wish to import more templates into the platform, you can easily do so. Microsoft Power BI offers a multitude of samples to its users to build their own visuals.
APIs for integration
Power BI enables the users to incorporate custom software with this business intelligence platform. It provides sample APIs and code that can assist the users in integrating the dashboard of Power BI with other software.
Advanced analytics
Cortana Analytics Suite is the Microsoft analytics program that enables the Power BI to access a variety of data management services which include Azure Data Lake, Azure Machine Learning, Stream Analytics, Azure Data Factory, SQL Data Warehouse, and Azure HDInsight. In this way, you can enjoy the services of a wide range of analytics instead of just one.
Enhance the efficiency and accuracy of publishing BI content
Microsoft Power BI has the capacity of enhancing publishing efficiency by quickly identifying the differences and taking the BI content from development to production processes. It does so by utilizing a wide range of simple visual cues present in the deployment pipelines of the platform.
User-friendly
Many developers found Power BI extremely user-friendly as it is extremely easy to navigate. Many people had to rely on report writers and consultants to get the job done. But with the incorporation of Power BI, they are now capable of making such reports on their own. Even the longtime Excel users have exclaimed that Power BI opens new doors of opportunities when it comes to making data schemas and reports.
Increase business productivity
Power BI helps in gathering the data of an organization and assembling it in one place. All the processes are seamless and occur without any hindrance. You won’t have to enter the data manually and run analytics. Everything will be taken care of. To make the decision-making process much easier, all the results are shown in a more understandable and reliable way.
Power BI Disadvantages
Apart from the benefits, Microsoft Power also has some setbacks. Let’s take a look at Power BI disadvantages.
No More SharePoint Integration
In the past, Power BI could be integrated with SharePoint but not anymore. SharePoint enabled the users to review and consume information easily. But now, the developers must have a Power BI app to fully consume the content on the dashboards. In this case, the interaction with the data would only be possible if the users leave the intranet site.
Can’t Interact with Non-Microsoft Sources of Data
Another major issue raised by the analysts is that Microsoft analysis services are unable to interact with non-Microsoft sources of data. A wide variety of data sources weren’t even available to the users till November 2015. The developers had to look elsewhere and finally, they went with SAP HANA which connects the previews of their data. However, this platform may have some potential bugs that raise some major security concerns.
No Theme and Branding Options
A few adopters of Microsoft Power BI have also complained that this tool lacks in providing themes and branding options. The community board of this business intelligence platform contains requests for chart theming or background-image support, like the ones that Microsoft Excel provides.
Feature Updates
Many developers are having problems with keeping up with new features’ release dates and enhancements. Microsoft constantly adds new features to its tool and makes sure that the word gets out on social media. But this means that developers have to remain in constant contact with those social media platforms or consultants. However, to tackle this, Microsoft has started to develop certain accounts and ask the partners to remain connected with them so that they can use the Power BI tools to their full potential.
Conclusion
Over the last few years, business intelligence and analytics have been the top-most priority of the IT experts of an organization. But they have faced numerous problems on the go. However, with the help of Microsoft Power BI, organizations can get rid of some of the major hurdles they face during data analysis. It provides a wide range of versions and components that makes data assembling and integration a whole lot easier.
Microsoft Power BI can help you in getting quick insights into the organization’s data and provide the results in the form of charts, diagrams, and visualizations. This business intelligence tool is easy to navigate and Microsoft keeps on adding more features so that you can utilize this tool at its full capacity. As for the pricing of Power BI, you can get the licensing options as per your business’s needs.
Was this article helpful?
Support us to keep up the good work and to provide you even better content. Your donations will be used to help students get access to quality content for free and pay our contributors’ salaries, who work hard to create this website content! Thank you for all your support!
Reaction to comment: Cancel reply