
CAGR
Compound Annual Growth Rate (abbreviated as CAGR) is a financial metric that expresses the average annual growth rate of a value-such as revenue, profit, investment, or number of customers—over a specific time period.
The goal is to determine how quickly the value of the tracked indicator grew (or declined) on average each year, taking into account compound interest—that is, the fact that growth in each year is based on a higher base than in the previous year.
What it’s used for
To measure long-term growth rates—for example, in:
- evaluating the average annual growth of a company’s revenue, profit, or turnover,
- analyzing the development of investments, funds, or portfolios,
- comparing growth dynamics between different companies or industries,
- assessing the development of market share or customer numbers over a longer time horizon,
- setting realistic targets for strategy and growth planning.
How is CAGR calculated – Compound Annual Growth Rate formula
CAGR is calculated using the formula:
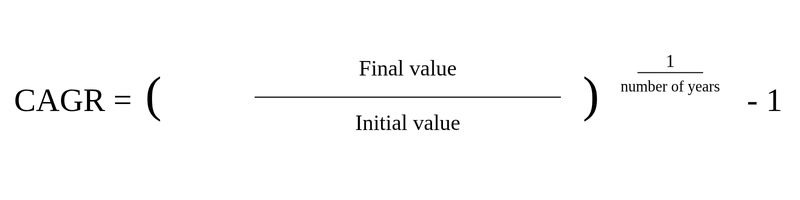
((Final value / Initial value) ^ (1 / number of years)) – 1
The result represents the average annual growth rate in percentages, which would lead to the same final value if growth were constant each year.
Example
A company invested 10 million CZK in 2020 and in 2025 the investment value was 18 million CZK.
CAGR = ((18 / 10)^(1 / 5)) – 1 = 0.125 = 12.5% annually.
This means that the average annual growth rate of the investment was 12.5%—even though growth in individual years could have varied, this value expresses uniform returns over a longer time horizon.
Why the CAGR metric is important
CAGR is among the most reliable indicators of long-term development because it eliminates the influence of short-term fluctuations and enables objective comparison of growth across time. Unlike simple year-over-year comparison (YoY), which works with a single difference, CAGR considers the entire period, thereby providing a more realistic picture of actual growth rate.
It helps to better assess:
- long-term growth of revenues, profit, or investments,
- stability and sustainability of growth trends,
- effectiveness of strategy over a multi-year period,
- actual returns on projects or investment funds over time.
This makes CAGR a common component of investment analyses, corporate reports, and strategic presentations for shareholders and management.
Difference from other metrics
- MoM (Month on Month) – month-over-month comparison that tracks rapid and short-term changes.
- QoQ (Quarter on Quarter) – measures quarter-over-quarter growth rate within a year.
- YoY (Year on Year) – shows annual change between two periods, suitable for short-term tracking.
- CAGR (Compound Annual Growth Rate) – accounts for an entire multi-year period and compound interest, providing the most accurate view of long-term trends (the term CAGR and its explanation and description are the desribed above).
What to watch out for with the CAGR metric
When interpreting, it’s important to remember that CAGR does not show actual fluctuations in individual years—it only calculates the uniform rate that leads to the same result. Therefore, it’s advisable to combine it with year-over-year data (YoY) or a chart of actual development.
Distortion can also occur if the initial value is unusually low or includes a one-time anomaly. Proper interpretation of CAGR requires knowledge of the context and the entire time development of the tracked indicator.
Was this article helpful?
Support us to keep up the good work and to provide you even better content. Your donations will be used to help students get access to quality content for free and pay our contributors’ salaries, who work hard to create this website content! Thank you for all your support!
Reaction to comment: Cancel reply