
How Do Sessions Work in Google Analytics?
The information stored in Google Analytics is used for lots of different work. This ranges from small decisions like reporting of daily marketing to more important decisions like making an investment. It is crucial to be familiar with how that data works. Today we will be discussing many different ways of how the session metrics in Google Analytics work that provides unexpected results, and as a reward, we’ll also be talking about how these sessions affect the time on page metric (and why you should reconsider using time on page for reporting).
In today’s post, we will talk about how sessions work in Google Analytics. All of us utilize Google Analytics; needless to say, it is a part of our everyday work.
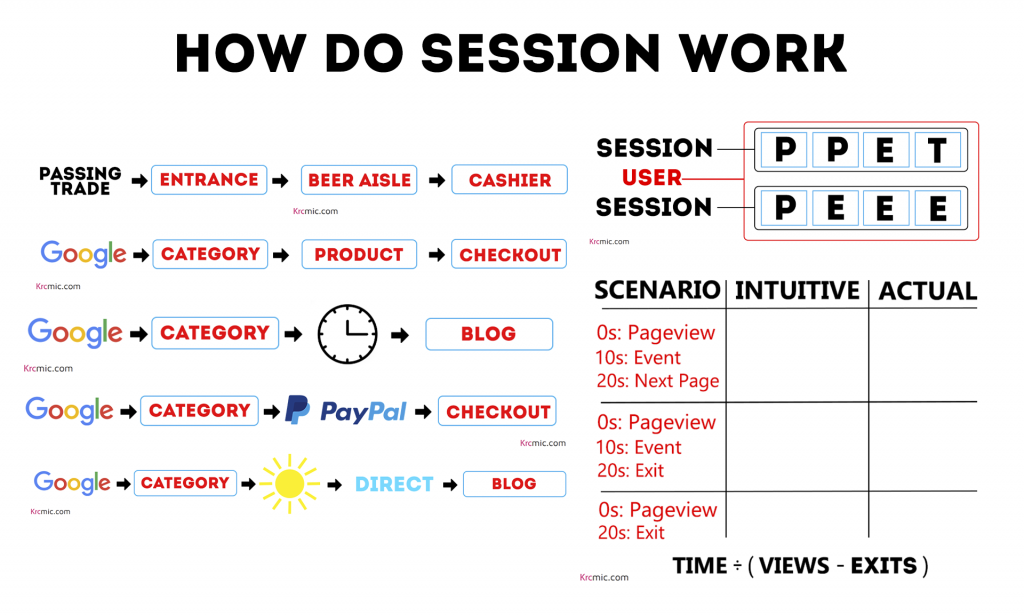
The information extracted from Google Analytics is used for a lot of things, which ranges from making a decision for investment or outlining the usage of the program in your business to the actual marketing. Hence, it is vital to be fond of the basic principles of this program. In the image above, I’ve highlighted the fundamentals. In the blue boxes, I’ve emphasized the hits that are reported to Google Analytics.
The one that I have mentioned as ‘P’ is a segment of tracking code you receive once you put Google Analytics on your website. Then you put that code on every page so that whenever a person loads that specific page, it forwards you a page view. So as you surf through your website, you get one page view after the other. I’ve also put an ‘E’ for the events and ‘T’ for the transactions. These are two more hit types that you may have put in.
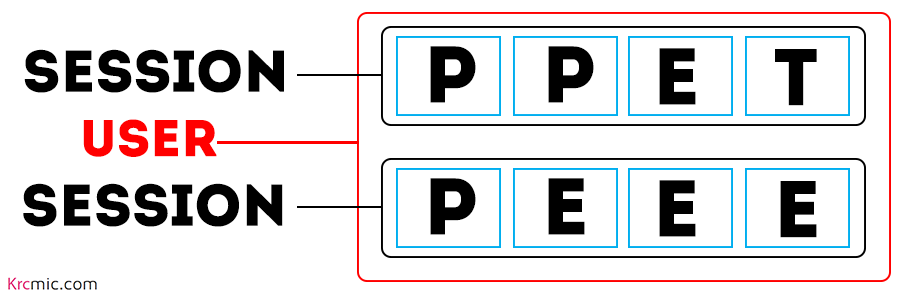
Google Analytics’ task is to receive the hit data you’re forwarding it and compile this information together in the form of sessions. These sessions are represented by black. If there are several different sessions from the same website, then it is representing a user that I’ve highlighted by the color red. The problem here is that you’ll have to randomly divide these sessions up
These eight hits could be compiled into one long session or eight small ones. So, today we’re going to discuss different ways Google Analytics works to split up these hit types into sessions. For better understanding, I’m going to give you some examples, but before that, to incorporate a real-life instance, I will talk about a brick-and-mortar store. In my opinion, that’s what they’re trying to imitate, and it will make better sense with that context.
Brick-and-mortar example

For example, suppose you enter a store by a passing trade. That passing trade would be your primary source. Moving forward, you enter the store through the entrance of the lobby. From there, you go by the beer aisle, moving towards the cashier. That makes this process one long session with the passing trade being the primary source. Makes sense?
However, in the case of a brick-and-mortar store, it’s not challenging to figure out the current number of sessions and dividing them. There’s barely any uncertainty in this case. Having said that, in the case of websites, when people leave their computer inactive for a while or don’t switch off their computer when they go for a holiday, it becomes harder to figure out when they’re coming and leaving. Consequently, the division process becomes more difficult as well.

Similarly, these sessions’ basic concept is very much alike: arrive by Google, category page, product page, checkout. That means we’ve got one long session now, and Google is the main source. The question that arises here is what are the ways that might go wrong or get divided?
Different things that can disturb a session:
1. Time Zone

First and foremost, even though it isn’t that big of an issue for some sites, however, the midnight in the time zone that is set into your Google Analytics setting can possibly divide the sessions.
Since Google Analytics doesn’t allow two different dates in one session so if you’re browsing late at night, that would make it two sessions. So that’ll make it one session with the main source being Google and one session with the main source being the website you were on. So, unless you’ve eliminated that from your settings, this makes it self-referral, which is clearly not helpful.
2. Coffee Breaks
Let’s say you’re in a famous supermarket in your country, and you feel the need to make a cup of coffee for yourself, that would make it one long session. In between that, Google is liable to make a decision that there has been a discontinuity for half an hour by default.
So again, if your computer is unattended for an hour or two, that would divide it into two sessions. For one, the category page would be the landing page, and this would make the landing page another self-referral because when you leave for your coffee break, and you come back, you’d likely resume things from where you left. These 30 minutes can be adjusted in your settings. However, many people leave it just as it is, and there isn’t any certainty that would either make this number always correct. As I said earlier, it’s sort of random.
3. Leaving The Site And Coming Back
The next issue I’d like to address is when a person leaves a site unattended and returns. When he enters the site from two different search engines, let’s say one from Google and one from Bing, you’d most probably count that as two separate sessions because they’re being directed from two different sources. However, it can get a little suspicious with external payment providers.

Unless Paypal is not a part of your referral list, if you start surfing from the category page to Paypal to the checkout, this would make it one long session, making an entrance from Google one session and entrance from checking out another. Lastly, I would like to talk about how sessions actually are.
4. Return Direct Sessions

Suppose you get to the category page through Google, go on holiday, and use a bookmark or type in something in the URL bar to come back. So ideally, that would clearly make it two sessions, right? One where you got the category page by Google and one from direct.
However, Google Analytics and most of its reports utilize previous non-direct clicks since you get over here from the source, so that leaves you with two sessions from Google. Then again, this timeout period can be changed. These are some unpredictable ways in which Google Analytics functions.
While we’re at it, as a reward, I’d like to let you know the effect of this on a specific metric, mostly for the purpose of convincing you to stop using it by clearing your misconceptions.
Three Situations in Which This Affects Time On-Page

So, I’ve brought up three different situations that I’d like to talk about to help you observe how the time on the page metric works.
Please keep in mind that, in most cases, Google Analytics has little data to process. It can also figure out the page on which you’ve landed, and it uses that information to send a page view. Let’s say if you went to a page and stayed on it for about 10 seconds, it won’t be able to figure out whether you stay on that page for 10 seconds or longer.
Since they don’t have a lot more information to process, it says, “Okay, we’re not going to include that in our average time on page metrics.” That leaves us with the formula of time divided by views minus exits. However, this has some consequences; let me take you through them.
1. Intuitive Time On Page = Actual Time On Page
Firstly, let’s suppose you land on a page. It forwards a page view just as it’s supposed to. After 10 seconds, you use another feature present on the site. That action leads you to click on the next page after 20 seconds. In this case, everything works as it’s supposed to. The reason is that Google Analytics contains enough data for another page view 20 seconds following the first. This way, they know that you were on the page for about 20 seconds.
In this scenario, the intuitive time spent on the page and the actual time you spent on the page are equal, which is 20 seconds in this case.
2. When The Intuitive Time On The Page Is Higher Than The Actual Time Spent On The Page
In this scenario, you landed on a page that generated a page view, but an event occurs 10 seconds later. However, in this case, instead of staying on the site and using its features, you leave the website. That leaves Google Analytics with no data, but since you were there on the site for 10 seconds, it would know that.
In this case, the intuitive time on the page is 20 seconds since that’s the time you spent looking at the page; however, the reported time would be 10 seconds since you left the site after 10 seconds.
3. The Time Measured On The Page is Zero
Lastly, let’s say you surf for about 20 seconds, and then you leave. In these 20 seconds, you didn’t take action on the website that would lead to an event. So, in this case, we’ve got an intuitive time on the page of 20 seconds, and the reported time is 0.
However, the captivating part of this process is that if you calculate the average time you spent on this page, you would expect it to be 20 seconds because that’s the amount of time you spent looking on the page. But when you think about the time reported by Google Analytics on how long you were on these pages would be an average of 10 seconds.
That makes enough sense, right? According to this formula, you have spent 30 seconds. So as we discussed earlier, according to the formula, you’ve got your total time, which is an average of 30 seconds, divided by the total number of views, which is 3, minus 2 exits. According to this, we’ve generated an average of about 30 seconds in these 3 sessions.
That took long enough, pardon me for the amount of your time I have consumed, but we finally have the average of these page views. To conclude, the one last tip that I’d like to give is to avoid using the average time on page as a reporting metric.
I hope you guys found today’s post helpful. I would love to know your opinions in the comment section below. Until next time, Goodbye!
Was this article helpful?
Support us to keep up the good work and to provide you even better content. Your donations will be used to help students get access to quality content for free and pay our contributors’ salaries, who work hard to create this website content! Thank you for all your support!
Reaction to comment: Cancel reply