
Churn Rate
Churn Rate (customer departure rate) is a comparative metric used in analysis to express how quickly a company is losing customers or repeat purchases in a specific time period – typically monthly or annually. It measures the percentage of customers who ended their relationship with the service, stopped buying, or canceled their subscription.
The goal is to identify weak points in customer retention, reveal structural problems in the business model, and optimize growth strategy by reducing losses in the customer base.
What is Churn Rate used for?
To evaluate customer departure and its impacts – for example, when:
- tracking growth or decline in the number of active customers,
- measuring loss of repeat purchases or subscription cancellations,
- analyzing MRR churn (loss of recurring monthly revenue due to customer departure),
- evaluating the effectiveness of retention campaigns and loyalty programs,
- monitoring the impact of customer departure on growth strategy and long-term customer value.
Customer churn rate and MRR churn rate
Two basic indicators are tracked for churn:
Notes:
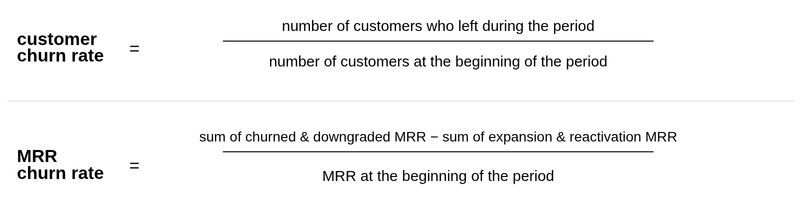
- Customer Churn Rate – relates to physical customers and measures the speed at which a business is losing specific customers or customer accounts.
- MRR Churn Rate (Monthly Recurring Revenue) – an indicator expressing as a percentage the total revenue loss resulting from customer departure in a given period. From a business perspective, it has greater informational value because it also considers the economic weight of individual customers.
Example: You have ten customers, but one of them is responsible for a quarter of your monthly revenue.
If they leave, Customer Churn Rate = 10%, but MRR Churn Rate will reach 25%.
How is it expressed?
Changes are typically expressed as percentages as the ratio of the number of customers who left to the total number of customers at the beginning of the period.
For example: 5% Churn Rate means that the company lost 5% of its customer base in the given period. This figure shows what portion of the customer base was lost – key information for managing growth and business sustainability.
Example
A company providing SaaS service had 1,000 active customers on January 1, 2025. By February 1, 2025, it lost 50 customers who canceled their subscription. The departure rate for January is thus 5% Churn Rate.
This means that for every 100 customers, it loses 5 monthly – and if this is not compensated by new customers or customers with higher revenues, the company’s growth will be at risk.
Voluntary vs. involuntary customer departure
- Voluntary (active) churn – customers voluntarily stop buying or cancel their subscription.
- Involuntary (passive) churn – the customer leaves unintentionally, for example, due to failed payment or technical error with payment method.
Tip: Passive churn should be addressed immediately – for example, with a reactivation campaign or notification about unpaid payment – before it spreads and gets out of control.
Negative Churn
Negative churn is considered the “holy grail” of growth and a symptom of a strong product and business model. It occurs when new revenue from existing customers (expansion, upsell, or reactivation) exceeds revenue lost due to departures.
In other words – a smaller but more active group of customers can compensate for revenue loss caused by the departure of some clients through their spending.
What Churn rate is good?
Generally, it’s stated that an acceptable customer departure rate ranges between 5-7% annually.
In reality, however, it depends on the industry, business model, and customer characteristics.
Tip: Start from the LTV/CAC ratio (Lifetime Value / Customer Acquisition Cost) and look for a balance that ensures healthy growth and profitability.
Cohort analysis – Churn Rate
Cohort analysis allows tracking at what point in the lifecycle departure is highest and how customer behavior evolves over time.
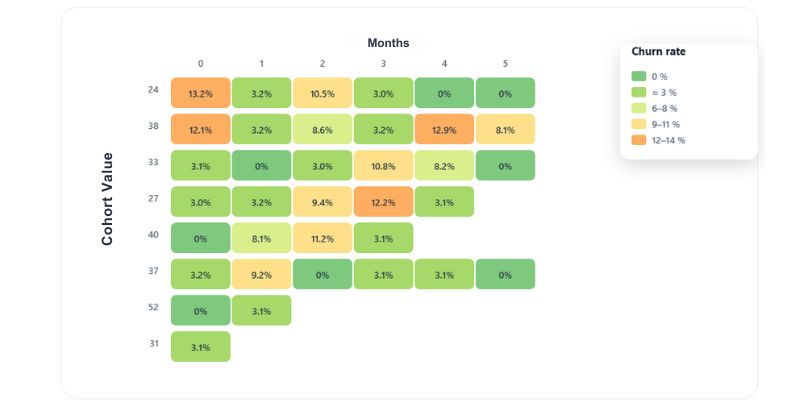
For example, it can reveal that churn is highest during the first or second month – which indicates insufficient communication of product value or weak onboarding.
Analysis of cohorts (groups of customers who converted in the same period) allows identifying critical phases and verifying whether new measures lead to lower churn in subsequent cohorts.
Why is this metric important?
Churn Rate is a key indicator of company health because it directly affects growth, revenue, and return on marketing investment. While acquisition metrics (e.g., CAC) show how much it costs to acquire a new customer, churn reveals how well the company retains its customers.
It helps to better assess:
- the effectiveness of retention measures and customer care,
- customer lifetime value (LTV) in relation to their acquisition cost (CAC),
- structural weaknesses in the business model – if churn is high, growth will be unsustainable,
- the speed at which new products, services, or price changes affect customer response.
This makes Churn Rate a fundamental tool for analysts, marketing, and management when evaluating company health and business models with recurring revenue.
What to watch out for with the Churn Rate metric
When interpreting, it’s important to:
- distinguish between Customer Churn and MRR Churn – losing one large customer can have a greater impact than ten smaller ones,
- not neglect passive churn and address technical causes of failed payments in time,
- track cohorts and discover at which phase of the lifecycle departure is highest,
- combine churn with LTV, CAC, and retention indicators for a complete view of customer base health.
Only then does this metric have real informational value and can be used as a reliable basis for planning growth, retention strategies, and budgeting.
Was this article helpful?
Support us to keep up the good work and to provide you even better content. Your donations will be used to help students get access to quality content for free and pay our contributors’ salaries, who work hard to create this website content! Thank you for all your support!
Reaction to comment: Cancel reply